Polish vs Panamanian Poverty
COMPARE
Polish
Panamanian
Poverty
Poverty Comparison
Poles
Panamanians
10.7%
POVERTY
99.5/ 100
METRIC RATING
31st/ 347
METRIC RANK
13.1%
POVERTY
6.6/ 100
METRIC RATING
207th/ 347
METRIC RANK
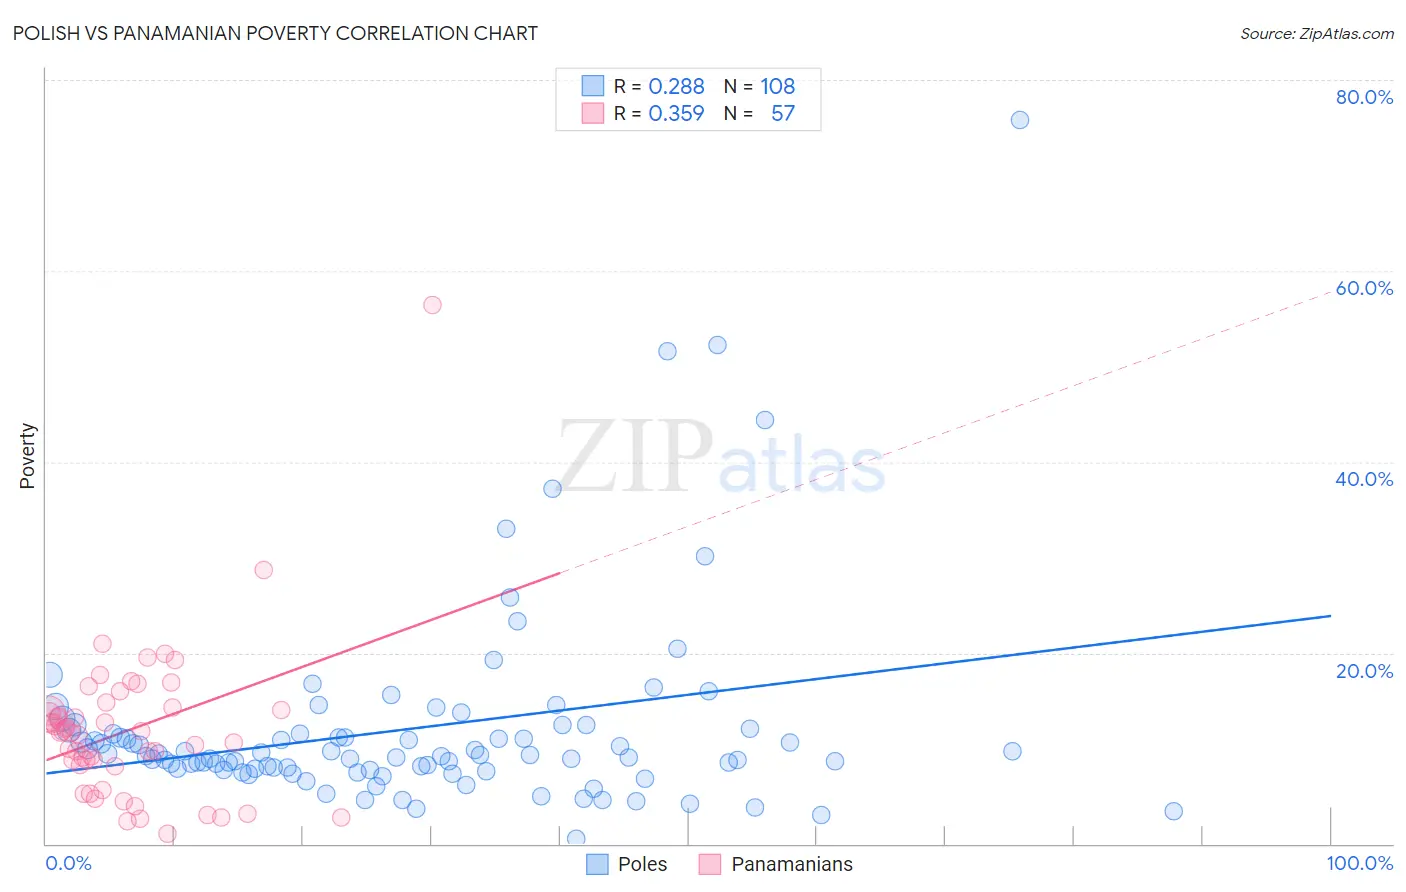
Polish vs Panamanian Poverty Correlation Chart
The statistical analysis conducted on geographies consisting of 559,734,720 people shows a weak positive correlation between the proportion of Poles and poverty level in the United States with a correlation coefficient (R) of 0.288 and weighted average of 10.7%. Similarly, the statistical analysis conducted on geographies consisting of 281,075,399 people shows a mild positive correlation between the proportion of Panamanians and poverty level in the United States with a correlation coefficient (R) of 0.359 and weighted average of 13.1%, a difference of 22.1%.
Poverty Correlation Summary
| Measurement | Polish | Panamanian |
| Minimum | 0.55% | 0.99% |
| Maximum | 75.7% | 56.4% |
| Range | 75.2% | 55.4% |
| Mean | 12.1% | 11.9% |
| Median | 9.2% | 11.7% |
| Interquartile 25% (IQ1) | 7.8% | 8.2% |
| Interquartile 75% (IQ3) | 11.7% | 14.1% |
| Interquartile Range (IQR) | 3.9% | 5.9% |
| Standard Deviation (Sample) | 10.5% | 8.1% |
| Standard Deviation (Population) | 10.5% | 8.1% |
Similar Demographics by Poverty
Demographics Similar to Poles by Poverty
In terms of poverty, the demographic groups most similar to Poles are Danish (10.7%, a difference of 0.080%), Greek (10.7%, a difference of 0.090%), Iranian (10.7%, a difference of 0.090%), Immigrants from Korea (10.7%, a difference of 0.19%), and Immigrants from Northern Europe (10.7%, a difference of 0.25%).
| Demographics | Rating | Rank | Poverty |
| Italians | 99.7 /100 | #24 | Exceptional 10.6% |
| Croatians | 99.6 /100 | #25 | Exceptional 10.6% |
| Burmese | 99.6 /100 | #26 | Exceptional 10.7% |
| Immigrants | Northern Europe | 99.6 /100 | #27 | Exceptional 10.7% |
| Immigrants | Korea | 99.5 /100 | #28 | Exceptional 10.7% |
| Greeks | 99.5 /100 | #29 | Exceptional 10.7% |
| Danes | 99.5 /100 | #30 | Exceptional 10.7% |
| Poles | 99.5 /100 | #31 | Exceptional 10.7% |
| Iranians | 99.5 /100 | #32 | Exceptional 10.7% |
| Macedonians | 99.4 /100 | #33 | Exceptional 10.8% |
| Immigrants | Poland | 99.4 /100 | #34 | Exceptional 10.8% |
| Tongans | 99.4 /100 | #35 | Exceptional 10.8% |
| Cypriots | 99.3 /100 | #36 | Exceptional 10.8% |
| Immigrants | Greece | 99.3 /100 | #37 | Exceptional 10.8% |
| Czechs | 99.3 /100 | #38 | Exceptional 10.8% |
Demographics Similar to Panamanians by Poverty
In terms of poverty, the demographic groups most similar to Panamanians are Immigrants from Eastern Africa (13.1%, a difference of 0.12%), Ugandan (13.1%, a difference of 0.15%), Malaysian (13.1%, a difference of 0.18%), Immigrants from the Azores (13.1%, a difference of 0.21%), and Moroccan (13.2%, a difference of 0.57%).
| Demographics | Rating | Rank | Poverty |
| Spaniards | 16.5 /100 | #200 | Poor 12.8% |
| Immigrants | Uganda | 16.5 /100 | #201 | Poor 12.8% |
| Immigrants | Uruguay | 15.6 /100 | #202 | Poor 12.8% |
| Hmong | 15.0 /100 | #203 | Poor 12.8% |
| Immigrants | Western Asia | 14.1 /100 | #204 | Poor 12.9% |
| Tsimshian | 9.2 /100 | #205 | Tragic 13.0% |
| Immigrants | Eastern Africa | 7.0 /100 | #206 | Tragic 13.1% |
| Panamanians | 6.6 /100 | #207 | Tragic 13.1% |
| Ugandans | 6.2 /100 | #208 | Tragic 13.1% |
| Malaysians | 6.1 /100 | #209 | Tragic 13.1% |
| Immigrants | Azores | 6.1 /100 | #210 | Tragic 13.1% |
| Moroccans | 5.2 /100 | #211 | Tragic 13.2% |
| Immigrants | Immigrants | 4.3 /100 | #212 | Tragic 13.2% |
| Immigrants | Panama | 4.1 /100 | #213 | Tragic 13.3% |
| Bermudans | 3.7 /100 | #214 | Tragic 13.3% |