Somali vs Immigrants from Uruguay Family Poverty
COMPARE
Somali
Immigrants from Uruguay
Family Poverty
Family Poverty Comparison
Somalis
Immigrants from Uruguay
11.2%
FAMILY POVERTY
0.1/ 100
METRIC RATING
273rd/ 347
METRIC RANK
9.5%
FAMILY POVERTY
14.0/ 100
METRIC RATING
209th/ 347
METRIC RANK
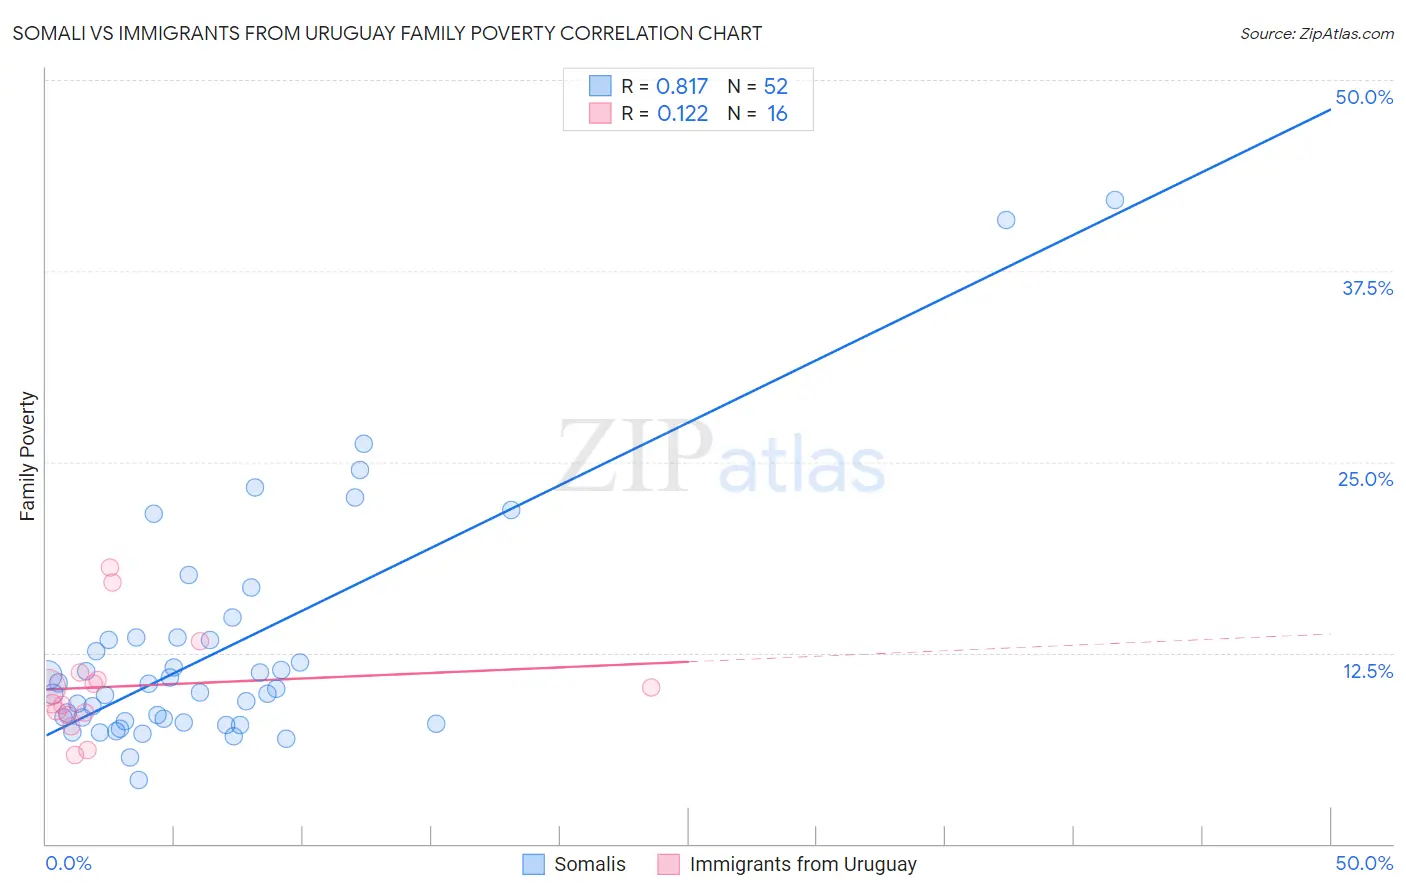
Somali vs Immigrants from Uruguay Family Poverty Correlation Chart
The statistical analysis conducted on geographies consisting of 99,253,282 people shows a very strong positive correlation between the proportion of Somalis and poverty level among families in the United States with a correlation coefficient (R) of 0.817 and weighted average of 11.2%. Similarly, the statistical analysis conducted on geographies consisting of 133,161,280 people shows a poor positive correlation between the proportion of Immigrants from Uruguay and poverty level among families in the United States with a correlation coefficient (R) of 0.122 and weighted average of 9.5%, a difference of 17.5%.
Family Poverty Correlation Summary
| Measurement | Somali | Immigrants from Uruguay |
| Minimum | 4.2% | 5.8% |
| Maximum | 42.2% | 18.1% |
| Range | 38.0% | 12.2% |
| Mean | 12.6% | 10.3% |
| Median | 10.0% | 9.7% |
| Interquartile 25% (IQ1) | 8.0% | 8.5% |
| Interquartile 75% (IQ3) | 13.4% | 11.0% |
| Interquartile Range (IQR) | 5.5% | 2.5% |
| Standard Deviation (Sample) | 7.7% | 3.4% |
| Standard Deviation (Population) | 7.7% | 3.3% |
Similar Demographics by Family Poverty
Demographics Similar to Somalis by Family Poverty
In terms of family poverty, the demographic groups most similar to Somalis are Spanish American (11.2%, a difference of 0.090%), Central American (11.2%, a difference of 0.13%), Immigrants from Guyana (11.2%, a difference of 0.16%), Chippewa (11.2%, a difference of 0.25%), and Guyanese (11.2%, a difference of 0.28%).
| Demographics | Rating | Rank | Family Poverty |
| Immigrants | El Salvador | 0.1 /100 | #266 | Tragic 11.0% |
| Comanche | 0.1 /100 | #267 | Tragic 11.0% |
| Jamaicans | 0.1 /100 | #268 | Tragic 11.1% |
| Immigrants | Ecuador | 0.1 /100 | #269 | Tragic 11.1% |
| Immigrants | Nicaragua | 0.1 /100 | #270 | Tragic 11.1% |
| Immigrants | Bahamas | 0.1 /100 | #271 | Tragic 11.1% |
| Immigrants | Jamaica | 0.1 /100 | #272 | Tragic 11.2% |
| Somalis | 0.1 /100 | #273 | Tragic 11.2% |
| Spanish Americans | 0.1 /100 | #274 | Tragic 11.2% |
| Central Americans | 0.1 /100 | #275 | Tragic 11.2% |
| Immigrants | Guyana | 0.1 /100 | #276 | Tragic 11.2% |
| Chippewa | 0.1 /100 | #277 | Tragic 11.2% |
| Guyanese | 0.1 /100 | #278 | Tragic 11.2% |
| Blackfeet | 0.0 /100 | #279 | Tragic 11.3% |
| Belizeans | 0.0 /100 | #280 | Tragic 11.3% |
Demographics Similar to Immigrants from Uruguay by Family Poverty
In terms of family poverty, the demographic groups most similar to Immigrants from Uruguay are Immigrants from Eastern Africa (9.5%, a difference of 0.29%), Sierra Leonean (9.5%, a difference of 0.40%), Alsatian (9.6%, a difference of 0.73%), Immigrants from South America (9.5%, a difference of 0.93%), and Aleut (9.5%, a difference of 0.94%).
| Demographics | Rating | Rank | Family Poverty |
| Immigrants | Sierra Leone | 19.6 /100 | #202 | Poor 9.4% |
| German Russians | 19.4 /100 | #203 | Poor 9.4% |
| Immigrants | Lebanon | 18.9 /100 | #204 | Poor 9.4% |
| Aleuts | 18.0 /100 | #205 | Poor 9.5% |
| Immigrants | South America | 18.0 /100 | #206 | Poor 9.5% |
| Sierra Leoneans | 15.6 /100 | #207 | Poor 9.5% |
| Immigrants | Eastern Africa | 15.1 /100 | #208 | Poor 9.5% |
| Immigrants | Uruguay | 14.0 /100 | #209 | Poor 9.5% |
| Alsatians | 11.3 /100 | #210 | Poor 9.6% |
| Malaysians | 10.6 /100 | #211 | Poor 9.6% |
| Immigrants | Thailand | 9.7 /100 | #212 | Tragic 9.7% |
| Osage | 8.0 /100 | #213 | Tragic 9.7% |
| Immigrants | Micronesia | 6.7 /100 | #214 | Tragic 9.8% |
| Immigrants | Nonimmigrants | 6.7 /100 | #215 | Tragic 9.8% |
| Moroccans | 6.5 /100 | #216 | Tragic 9.8% |