Houma vs Immigrants from Congo Receiving Food Stamps
COMPARE
Houma
Immigrants from Congo
Receiving Food Stamps
Receiving Food Stamps Comparison
Houma
Immigrants from Congo
16.5%
RECEIVING FOOD STAMPS
0.0/ 100
METRIC RATING
307th/ 347
METRIC RANK
14.1%
RECEIVING FOOD STAMPS
0.3/ 100
METRIC RATING
261st/ 347
METRIC RANK
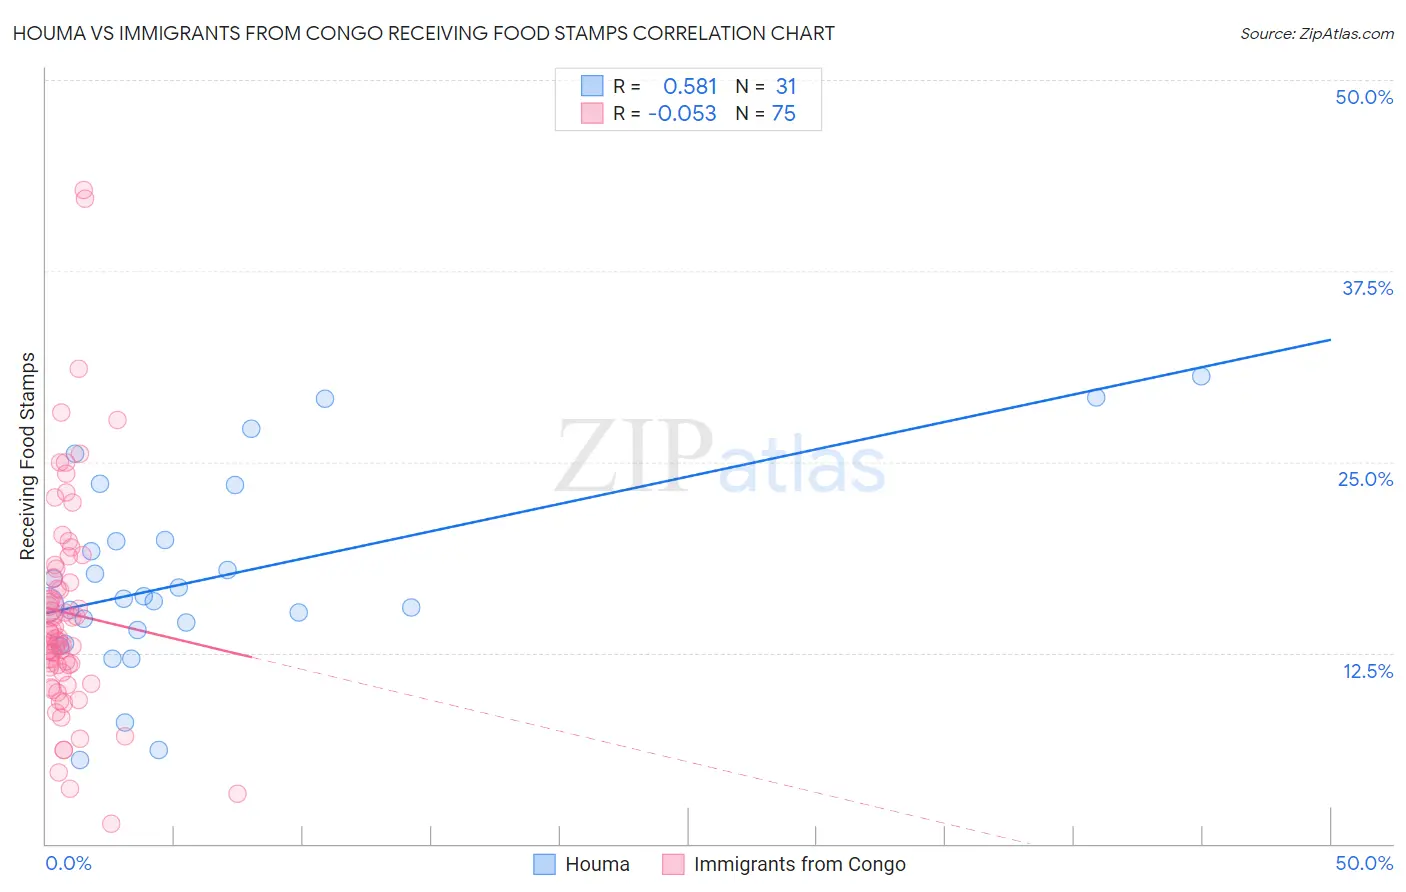
Houma vs Immigrants from Congo Receiving Food Stamps Correlation Chart
The statistical analysis conducted on geographies consisting of 36,773,946 people shows a substantial positive correlation between the proportion of Houma and percentage of population receiving government assistance and/or food stamps in the United States with a correlation coefficient (R) of 0.581 and weighted average of 16.5%. Similarly, the statistical analysis conducted on geographies consisting of 92,058,964 people shows a slight negative correlation between the proportion of Immigrants from Congo and percentage of population receiving government assistance and/or food stamps in the United States with a correlation coefficient (R) of -0.053 and weighted average of 14.1%, a difference of 16.3%.
Receiving Food Stamps Correlation Summary
| Measurement | Houma | Immigrants from Congo |
| Minimum | 5.5% | 1.3% |
| Maximum | 30.6% | 42.8% |
| Range | 25.1% | 41.5% |
| Mean | 17.4% | 15.1% |
| Median | 16.0% | 13.5% |
| Interquartile 25% (IQ1) | 14.0% | 11.2% |
| Interquartile 75% (IQ3) | 19.9% | 18.0% |
| Interquartile Range (IQR) | 5.9% | 6.8% |
| Standard Deviation (Sample) | 6.3% | 7.4% |
| Standard Deviation (Population) | 6.2% | 7.4% |
Similar Demographics by Receiving Food Stamps
Demographics Similar to Houma by Receiving Food Stamps
In terms of receiving food stamps, the demographic groups most similar to Houma are Barbadian (16.5%, a difference of 0.26%), Jamaican (16.4%, a difference of 0.29%), Immigrants from the Azores (16.4%, a difference of 0.35%), U.S. Virgin Islander (16.5%, a difference of 0.50%), and Immigrants from Barbados (16.6%, a difference of 1.1%).
| Demographics | Rating | Rank | Receiving Food Stamps |
| Immigrants | Bangladesh | 0.0 /100 | #300 | Tragic 15.9% |
| Trinidadians and Tobagonians | 0.0 /100 | #301 | Tragic 16.0% |
| Immigrants | West Indies | 0.0 /100 | #302 | Tragic 16.1% |
| Nicaraguans | 0.0 /100 | #303 | Tragic 16.1% |
| West Indians | 0.0 /100 | #304 | Tragic 16.3% |
| Immigrants | Azores | 0.0 /100 | #305 | Tragic 16.4% |
| Jamaicans | 0.0 /100 | #306 | Tragic 16.4% |
| Houma | 0.0 /100 | #307 | Tragic 16.5% |
| Barbadians | 0.0 /100 | #308 | Tragic 16.5% |
| U.S. Virgin Islanders | 0.0 /100 | #309 | Tragic 16.5% |
| Immigrants | Barbados | 0.0 /100 | #310 | Tragic 16.6% |
| Guyanese | 0.0 /100 | #311 | Tragic 16.7% |
| Sioux | 0.0 /100 | #312 | Tragic 16.8% |
| Immigrants | Jamaica | 0.0 /100 | #313 | Tragic 16.9% |
| Immigrants | Guyana | 0.0 /100 | #314 | Tragic 16.9% |
Demographics Similar to Immigrants from Congo by Receiving Food Stamps
In terms of receiving food stamps, the demographic groups most similar to Immigrants from Congo are Central American (14.1%, a difference of 0.010%), Creek (14.1%, a difference of 0.11%), Immigrants from Ghana (14.1%, a difference of 0.23%), Arapaho (14.1%, a difference of 0.31%), and Japanese (14.1%, a difference of 0.41%).
| Demographics | Rating | Rank | Receiving Food Stamps |
| Marshallese | 0.3 /100 | #254 | Tragic 14.1% |
| Sub-Saharan Africans | 0.3 /100 | #255 | Tragic 14.1% |
| Japanese | 0.3 /100 | #256 | Tragic 14.1% |
| Arapaho | 0.3 /100 | #257 | Tragic 14.1% |
| Immigrants | Ghana | 0.3 /100 | #258 | Tragic 14.1% |
| Creek | 0.3 /100 | #259 | Tragic 14.1% |
| Central Americans | 0.3 /100 | #260 | Tragic 14.1% |
| Immigrants | Congo | 0.3 /100 | #261 | Tragic 14.1% |
| Paiute | 0.2 /100 | #262 | Tragic 14.3% |
| Immigrants | Portugal | 0.2 /100 | #263 | Tragic 14.3% |
| Immigrants | Uzbekistan | 0.2 /100 | #264 | Tragic 14.3% |
| Blackfeet | 0.2 /100 | #265 | Tragic 14.3% |
| Cheyenne | 0.2 /100 | #266 | Tragic 14.3% |
| Dutch West Indians | 0.2 /100 | #267 | Tragic 14.3% |
| Guatemalans | 0.1 /100 | #268 | Tragic 14.4% |