Houma vs Immigrants from Congo Currently Married
COMPARE
Houma
Immigrants from Congo
Currently Married
Currently Married Comparison
Houma
Immigrants from Congo
45.5%
CURRENTLY MARRIED
7.2/ 100
METRIC RATING
211th/ 347
METRIC RANK
41.1%
CURRENTLY MARRIED
0.0/ 100
METRIC RATING
321st/ 347
METRIC RANK
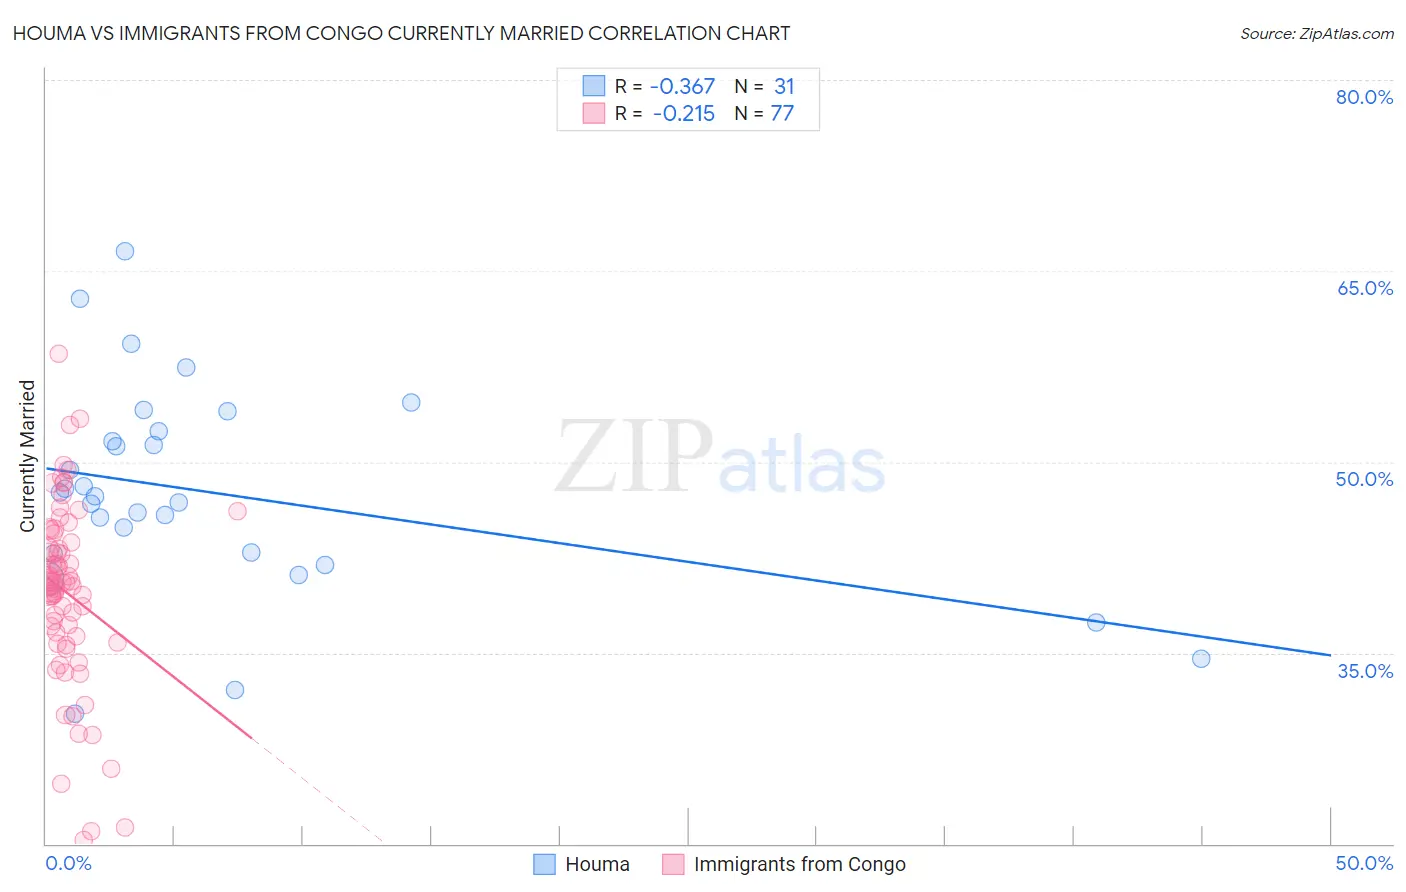
Houma vs Immigrants from Congo Currently Married Correlation Chart
The statistical analysis conducted on geographies consisting of 36,796,778 people shows a mild negative correlation between the proportion of Houma and percentage of population currently married in the United States with a correlation coefficient (R) of -0.367 and weighted average of 45.5%. Similarly, the statistical analysis conducted on geographies consisting of 92,127,634 people shows a weak negative correlation between the proportion of Immigrants from Congo and percentage of population currently married in the United States with a correlation coefficient (R) of -0.215 and weighted average of 41.1%, a difference of 11.0%.
Currently Married Correlation Summary
| Measurement | Houma | Immigrants from Congo |
| Minimum | 30.2% | 20.3% |
| Maximum | 66.5% | 58.5% |
| Range | 36.3% | 38.2% |
| Mean | 47.6% | 39.7% |
| Median | 47.3% | 40.3% |
| Interquartile 25% (IQ1) | 42.8% | 36.0% |
| Interquartile 75% (IQ3) | 52.4% | 44.0% |
| Interquartile Range (IQR) | 9.6% | 8.0% |
| Standard Deviation (Sample) | 8.2% | 7.2% |
| Standard Deviation (Population) | 8.1% | 7.2% |
Similar Demographics by Currently Married
Demographics Similar to Houma by Currently Married
In terms of currently married, the demographic groups most similar to Houma are Marshallese (45.5%, a difference of 0.010%), Alaska Native (45.5%, a difference of 0.040%), Dutch West Indian (45.5%, a difference of 0.080%), German Russian (45.5%, a difference of 0.080%), and Uruguayan (45.6%, a difference of 0.090%).
| Demographics | Rating | Rank | Currently Married |
| Immigrants | Spain | 11.6 /100 | #204 | Poor 45.8% |
| South American Indians | 11.5 /100 | #205 | Poor 45.8% |
| Immigrants | Immigrants | 11.2 /100 | #206 | Poor 45.8% |
| Immigrants | South America | 10.8 /100 | #207 | Poor 45.7% |
| Alsatians | 10.8 /100 | #208 | Poor 45.7% |
| Immigrants | Micronesia | 8.8 /100 | #209 | Tragic 45.6% |
| Uruguayans | 7.9 /100 | #210 | Tragic 45.6% |
| Houma | 7.2 /100 | #211 | Tragic 45.5% |
| Marshallese | 7.2 /100 | #212 | Tragic 45.5% |
| Alaska Natives | 7.0 /100 | #213 | Tragic 45.5% |
| Dutch West Indians | 6.7 /100 | #214 | Tragic 45.5% |
| German Russians | 6.7 /100 | #215 | Tragic 45.5% |
| Immigrants | Morocco | 5.5 /100 | #216 | Tragic 45.4% |
| Immigrants | Thailand | 5.1 /100 | #217 | Tragic 45.4% |
| Panamanians | 4.0 /100 | #218 | Tragic 45.3% |
Demographics Similar to Immigrants from Congo by Currently Married
In terms of currently married, the demographic groups most similar to Immigrants from Congo are Immigrants from Haiti (41.0%, a difference of 0.13%), Immigrants from Jamaica (41.1%, a difference of 0.23%), Immigrants from Somalia (41.2%, a difference of 0.29%), Bahamian (41.2%, a difference of 0.31%), and Haitian (41.3%, a difference of 0.49%).
| Demographics | Rating | Rank | Currently Married |
| West Indians | 0.0 /100 | #314 | Tragic 41.3% |
| Inupiat | 0.0 /100 | #315 | Tragic 41.3% |
| Immigrants | Caribbean | 0.0 /100 | #316 | Tragic 41.3% |
| Haitians | 0.0 /100 | #317 | Tragic 41.3% |
| Bahamians | 0.0 /100 | #318 | Tragic 41.2% |
| Immigrants | Somalia | 0.0 /100 | #319 | Tragic 41.2% |
| Immigrants | Jamaica | 0.0 /100 | #320 | Tragic 41.1% |
| Immigrants | Congo | 0.0 /100 | #321 | Tragic 41.1% |
| Immigrants | Haiti | 0.0 /100 | #322 | Tragic 41.0% |
| Immigrants | West Indies | 0.0 /100 | #323 | Tragic 40.7% |
| Immigrants | Senegal | 0.0 /100 | #324 | Tragic 40.7% |
| U.S. Virgin Islanders | 0.0 /100 | #325 | Tragic 40.7% |
| Barbadians | 0.0 /100 | #326 | Tragic 40.6% |
| Senegalese | 0.0 /100 | #327 | Tragic 40.6% |
| Arapaho | 0.0 /100 | #328 | Tragic 40.5% |