Houma vs Immigrants from Congo Doctorate Degree
COMPARE
Houma
Immigrants from Congo
Doctorate Degree
Doctorate Degree Comparison
Houma
Immigrants from Congo
0.96%
DOCTORATE DEGREE
0.0/ 100
METRIC RATING
347th/ 347
METRIC RANK
1.6%
DOCTORATE DEGREE
2.6/ 100
METRIC RATING
238th/ 347
METRIC RANK
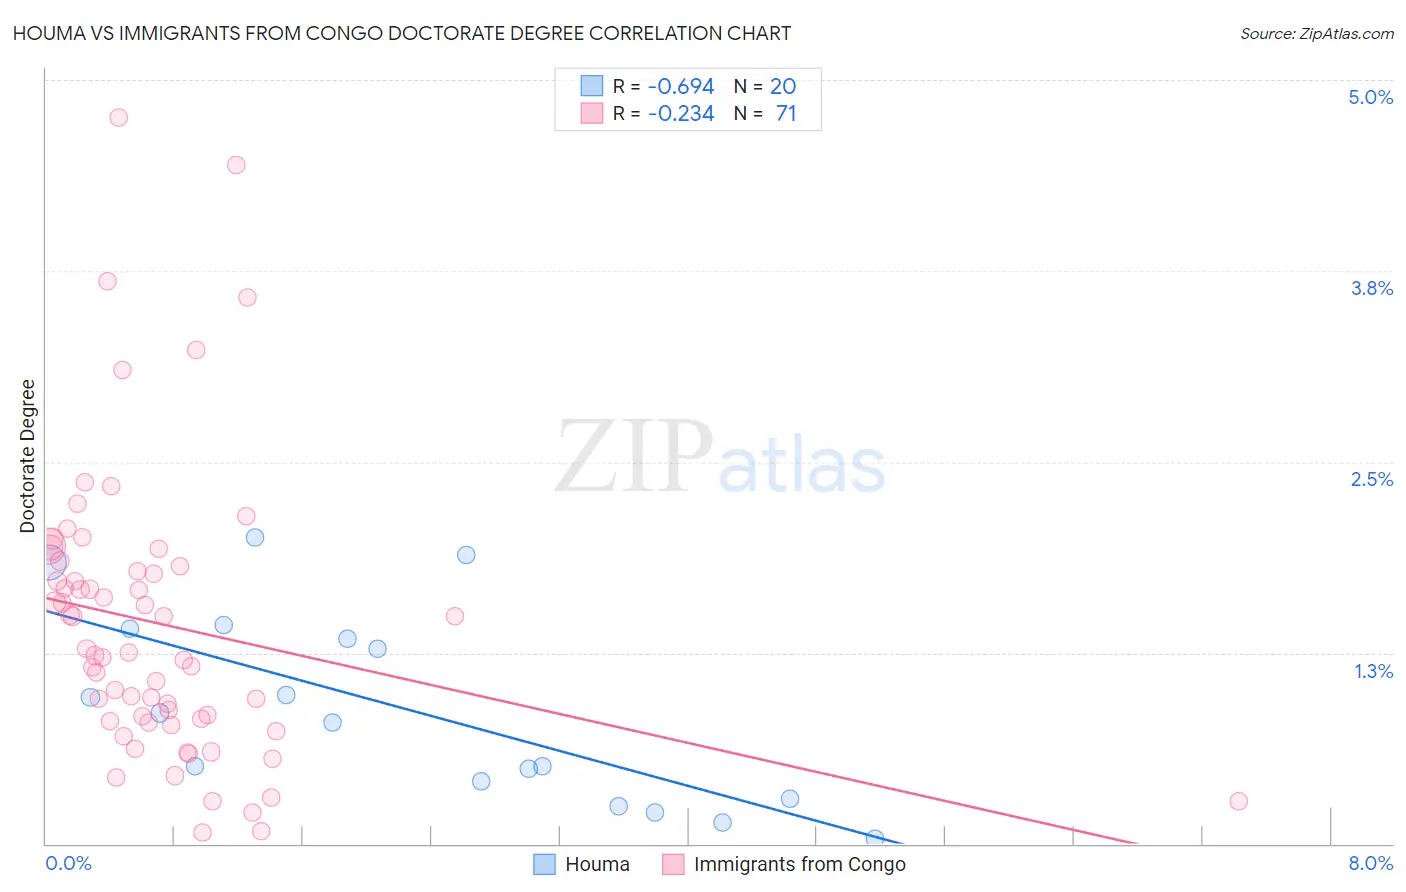
Houma vs Immigrants from Congo Doctorate Degree Correlation Chart
The statistical analysis conducted on geographies consisting of 36,552,567 people shows a significant negative correlation between the proportion of Houma and percentage of population with at least doctorate degree education in the United States with a correlation coefficient (R) of -0.694 and weighted average of 0.96%. Similarly, the statistical analysis conducted on geographies consisting of 91,930,885 people shows a weak negative correlation between the proportion of Immigrants from Congo and percentage of population with at least doctorate degree education in the United States with a correlation coefficient (R) of -0.234 and weighted average of 1.6%, a difference of 66.3%.
Doctorate Degree Correlation Summary
| Measurement | Houma | Immigrants from Congo |
| Minimum | 0.036% | 0.075% |
| Maximum | 2.0% | 4.8% |
| Range | 2.0% | 4.7% |
| Mean | 0.88% | 1.4% |
| Median | 0.82% | 1.3% |
| Interquartile 25% (IQ1) | 0.35% | 0.80% |
| Interquartile 75% (IQ3) | 1.4% | 1.8% |
| Interquartile Range (IQR) | 1.0% | 1.0% |
| Standard Deviation (Sample) | 0.62% | 0.94% |
| Standard Deviation (Population) | 0.60% | 0.93% |
Similar Demographics by Doctorate Degree
Demographics Similar to Houma by Doctorate Degree
In terms of doctorate degree, the demographic groups most similar to Houma are Spanish American Indian (1.1%, a difference of 10.5%), Lumbee (1.1%, a difference of 13.7%), Immigrants from Mexico (1.1%, a difference of 15.3%), Fijian (1.1%, a difference of 17.8%), and Arapaho (1.2%, a difference of 21.8%).
| Demographics | Rating | Rank | Doctorate Degree |
| Immigrants | Caribbean | 0.0 /100 | #333 | Tragic 1.3% |
| Immigrants | Dominican Republic | 0.0 /100 | #334 | Tragic 1.3% |
| Immigrants | Haiti | 0.0 /100 | #335 | Tragic 1.3% |
| Nepalese | 0.0 /100 | #336 | Tragic 1.3% |
| Bangladeshis | 0.0 /100 | #337 | Tragic 1.2% |
| Puget Sound Salish | 0.0 /100 | #338 | Tragic 1.2% |
| Immigrants | Central America | 0.0 /100 | #339 | Tragic 1.2% |
| Immigrants | Cuba | 0.0 /100 | #340 | Tragic 1.2% |
| Mexicans | 0.0 /100 | #341 | Tragic 1.2% |
| Arapaho | 0.0 /100 | #342 | Tragic 1.2% |
| Fijians | 0.0 /100 | #343 | Tragic 1.1% |
| Immigrants | Mexico | 0.0 /100 | #344 | Tragic 1.1% |
| Lumbee | 0.0 /100 | #345 | Tragic 1.1% |
| Spanish American Indians | 0.0 /100 | #346 | Tragic 1.1% |
| Houma | 0.0 /100 | #347 | Tragic 0.96% |
Demographics Similar to Immigrants from Congo by Doctorate Degree
In terms of doctorate degree, the demographic groups most similar to Immigrants from Congo are West Indian (1.6%, a difference of 0.10%), Iroquois (1.6%, a difference of 0.20%), Immigrants from Panama (1.6%, a difference of 0.29%), Indonesian (1.6%, a difference of 0.39%), and Cheyenne (1.6%, a difference of 0.48%).
| Demographics | Rating | Rank | Doctorate Degree |
| Immigrants | North Macedonia | 3.9 /100 | #231 | Tragic 1.6% |
| Guamanians/Chamorros | 3.3 /100 | #232 | Tragic 1.6% |
| Barbadians | 3.3 /100 | #233 | Tragic 1.6% |
| Hopi | 3.2 /100 | #234 | Tragic 1.6% |
| Cree | 3.0 /100 | #235 | Tragic 1.6% |
| Indonesians | 2.8 /100 | #236 | Tragic 1.6% |
| Iroquois | 2.7 /100 | #237 | Tragic 1.6% |
| Immigrants | Congo | 2.6 /100 | #238 | Tragic 1.6% |
| West Indians | 2.5 /100 | #239 | Tragic 1.6% |
| Immigrants | Panama | 2.4 /100 | #240 | Tragic 1.6% |
| Cheyenne | 2.3 /100 | #241 | Tragic 1.6% |
| Ottawa | 2.2 /100 | #242 | Tragic 1.6% |
| Native Hawaiians | 2.1 /100 | #243 | Tragic 1.6% |
| French American Indians | 2.0 /100 | #244 | Tragic 1.6% |
| Delaware | 1.9 /100 | #245 | Tragic 1.6% |