Houma vs Uruguayan Receiving Food Stamps
COMPARE
Houma
Uruguayan
Receiving Food Stamps
Receiving Food Stamps Comparison
Houma
Uruguayans
16.5%
RECEIVING FOOD STAMPS
0.0/ 100
METRIC RATING
307th/ 347
METRIC RANK
11.8%
RECEIVING FOOD STAMPS
44.8/ 100
METRIC RATING
180th/ 347
METRIC RANK
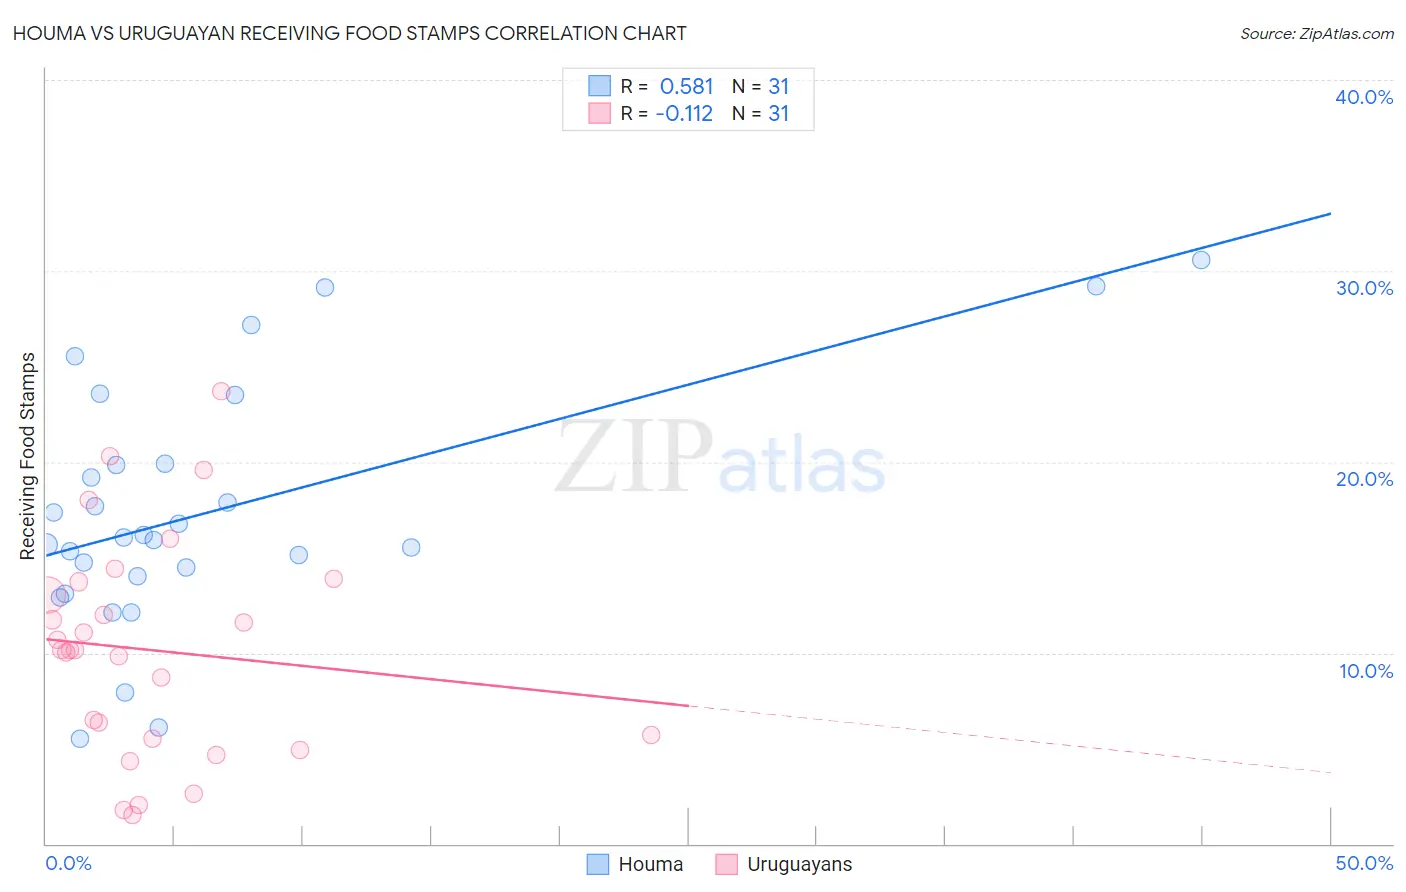
Houma vs Uruguayan Receiving Food Stamps Correlation Chart
The statistical analysis conducted on geographies consisting of 36,773,946 people shows a substantial positive correlation between the proportion of Houma and percentage of population receiving government assistance and/or food stamps in the United States with a correlation coefficient (R) of 0.581 and weighted average of 16.5%. Similarly, the statistical analysis conducted on geographies consisting of 144,715,533 people shows a poor negative correlation between the proportion of Uruguayans and percentage of population receiving government assistance and/or food stamps in the United States with a correlation coefficient (R) of -0.112 and weighted average of 11.8%, a difference of 39.2%.
Receiving Food Stamps Correlation Summary
| Measurement | Houma | Uruguayan |
| Minimum | 5.5% | 1.5% |
| Maximum | 30.6% | 23.7% |
| Range | 25.1% | 22.2% |
| Mean | 17.4% | 10.1% |
| Median | 16.0% | 10.1% |
| Interquartile 25% (IQ1) | 14.0% | 5.5% |
| Interquartile 75% (IQ3) | 19.9% | 13.7% |
| Interquartile Range (IQR) | 5.9% | 8.2% |
| Standard Deviation (Sample) | 6.3% | 5.7% |
| Standard Deviation (Population) | 6.2% | 5.6% |
Similar Demographics by Receiving Food Stamps
Demographics Similar to Houma by Receiving Food Stamps
In terms of receiving food stamps, the demographic groups most similar to Houma are Barbadian (16.5%, a difference of 0.26%), Jamaican (16.4%, a difference of 0.29%), Immigrants from the Azores (16.4%, a difference of 0.35%), U.S. Virgin Islander (16.5%, a difference of 0.50%), and Immigrants from Barbados (16.6%, a difference of 1.1%).
| Demographics | Rating | Rank | Receiving Food Stamps |
| Immigrants | Bangladesh | 0.0 /100 | #300 | Tragic 15.9% |
| Trinidadians and Tobagonians | 0.0 /100 | #301 | Tragic 16.0% |
| Immigrants | West Indies | 0.0 /100 | #302 | Tragic 16.1% |
| Nicaraguans | 0.0 /100 | #303 | Tragic 16.1% |
| West Indians | 0.0 /100 | #304 | Tragic 16.3% |
| Immigrants | Azores | 0.0 /100 | #305 | Tragic 16.4% |
| Jamaicans | 0.0 /100 | #306 | Tragic 16.4% |
| Houma | 0.0 /100 | #307 | Tragic 16.5% |
| Barbadians | 0.0 /100 | #308 | Tragic 16.5% |
| U.S. Virgin Islanders | 0.0 /100 | #309 | Tragic 16.5% |
| Immigrants | Barbados | 0.0 /100 | #310 | Tragic 16.6% |
| Guyanese | 0.0 /100 | #311 | Tragic 16.7% |
| Sioux | 0.0 /100 | #312 | Tragic 16.8% |
| Immigrants | Jamaica | 0.0 /100 | #313 | Tragic 16.9% |
| Immigrants | Guyana | 0.0 /100 | #314 | Tragic 16.9% |
Demographics Similar to Uruguayans by Receiving Food Stamps
In terms of receiving food stamps, the demographic groups most similar to Uruguayans are Immigrants from Kenya (11.8%, a difference of 0.22%), South American Indian (11.9%, a difference of 0.44%), German Russian (11.8%, a difference of 0.46%), Immigrants from Ukraine (11.8%, a difference of 0.50%), and Immigrants from Morocco (11.9%, a difference of 0.59%).
| Demographics | Rating | Rank | Receiving Food Stamps |
| Immigrants | Syria | 53.4 /100 | #173 | Average 11.7% |
| Immigrants | Eritrea | 50.0 /100 | #174 | Average 11.7% |
| Osage | 49.8 /100 | #175 | Average 11.7% |
| Peruvians | 49.3 /100 | #176 | Average 11.7% |
| Immigrants | Ukraine | 48.4 /100 | #177 | Average 11.8% |
| German Russians | 48.1 /100 | #178 | Average 11.8% |
| Immigrants | Kenya | 46.4 /100 | #179 | Average 11.8% |
| Uruguayans | 44.8 /100 | #180 | Average 11.8% |
| South American Indians | 41.7 /100 | #181 | Average 11.9% |
| Immigrants | Morocco | 40.7 /100 | #182 | Average 11.9% |
| Immigrants | Uganda | 40.3 /100 | #183 | Average 11.9% |
| Spaniards | 39.8 /100 | #184 | Fair 11.9% |
| Immigrants | Iraq | 37.1 /100 | #185 | Fair 12.0% |
| Spanish | 36.9 /100 | #186 | Fair 12.0% |
| Albanians | 35.4 /100 | #187 | Fair 12.0% |