Immigrants from South Central Asia vs Immigrants from Congo Receiving Food Stamps
COMPARE
Immigrants from South Central Asia
Immigrants from Congo
Receiving Food Stamps
Receiving Food Stamps Comparison
Immigrants from South Central Asia
Immigrants from Congo
8.8%
RECEIVING FOOD STAMPS
99.9/ 100
METRIC RATING
10th/ 347
METRIC RANK
14.1%
RECEIVING FOOD STAMPS
0.3/ 100
METRIC RATING
261st/ 347
METRIC RANK
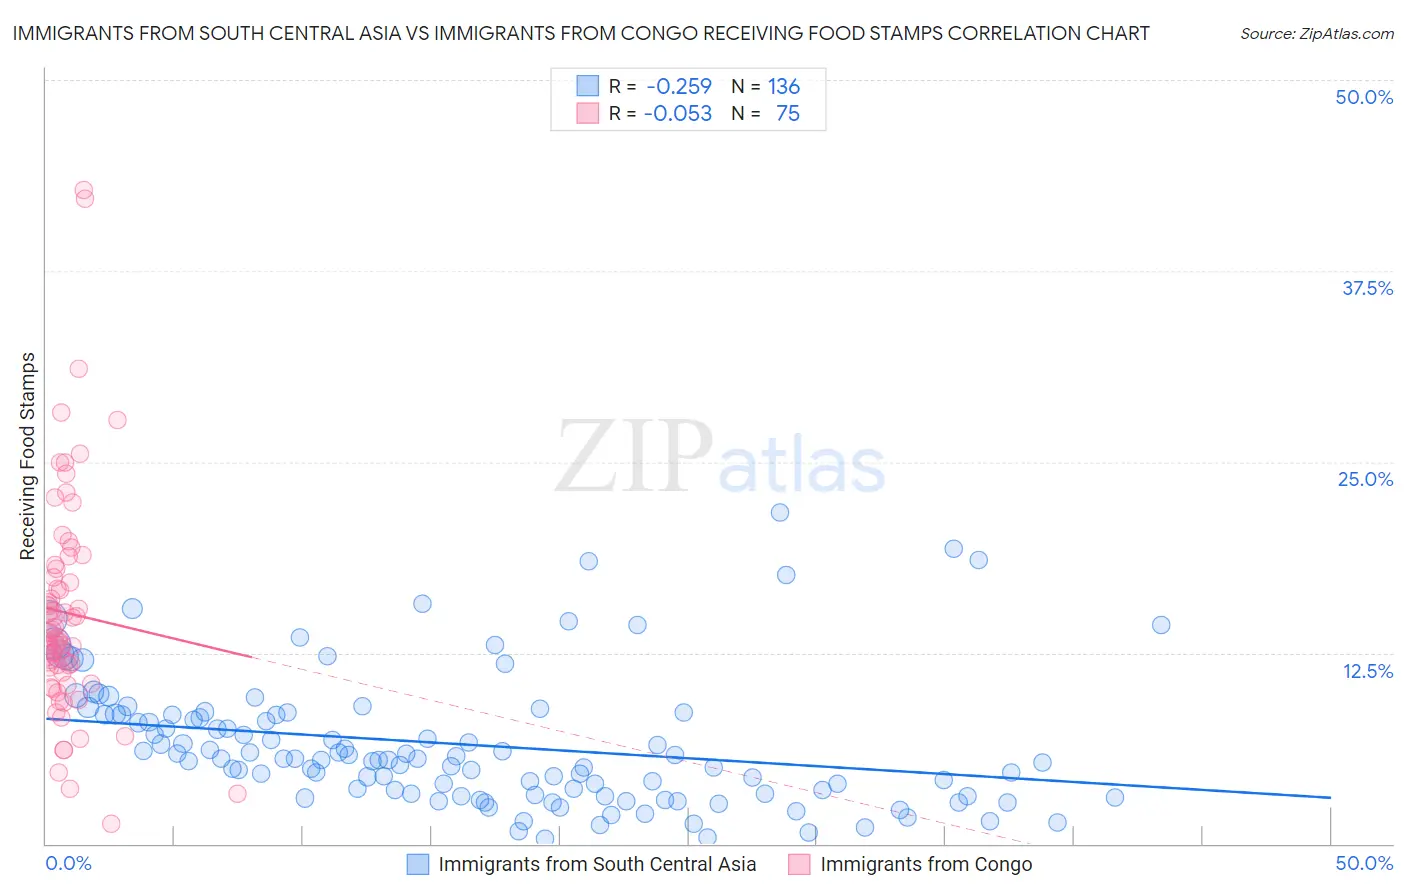
Immigrants from South Central Asia vs Immigrants from Congo Receiving Food Stamps Correlation Chart
The statistical analysis conducted on geographies consisting of 471,034,048 people shows a weak negative correlation between the proportion of Immigrants from South Central Asia and percentage of population receiving government assistance and/or food stamps in the United States with a correlation coefficient (R) of -0.259 and weighted average of 8.8%. Similarly, the statistical analysis conducted on geographies consisting of 92,058,964 people shows a slight negative correlation between the proportion of Immigrants from Congo and percentage of population receiving government assistance and/or food stamps in the United States with a correlation coefficient (R) of -0.053 and weighted average of 14.1%, a difference of 60.2%.
Receiving Food Stamps Correlation Summary
| Measurement | Immigrants from South Central Asia | Immigrants from Congo |
| Minimum | 0.30% | 1.3% |
| Maximum | 21.7% | 42.8% |
| Range | 21.4% | 41.5% |
| Mean | 6.5% | 15.1% |
| Median | 5.6% | 13.5% |
| Interquartile 25% (IQ1) | 3.3% | 11.2% |
| Interquartile 75% (IQ3) | 8.5% | 18.0% |
| Interquartile Range (IQR) | 5.2% | 6.8% |
| Standard Deviation (Sample) | 4.3% | 7.4% |
| Standard Deviation (Population) | 4.3% | 7.4% |
Similar Demographics by Receiving Food Stamps
Demographics Similar to Immigrants from South Central Asia by Receiving Food Stamps
In terms of receiving food stamps, the demographic groups most similar to Immigrants from South Central Asia are Okinawan (8.9%, a difference of 0.43%), Cypriot (8.9%, a difference of 0.44%), Bulgarian (8.9%, a difference of 0.63%), Maltese (8.9%, a difference of 0.77%), and Norwegian (9.0%, a difference of 1.4%).
| Demographics | Rating | Rank | Receiving Food Stamps |
| Filipinos | 100.0 /100 | #3 | Exceptional 7.4% |
| Iranians | 100.0 /100 | #4 | Exceptional 7.9% |
| Thais | 100.0 /100 | #5 | Exceptional 8.1% |
| Immigrants | Singapore | 100.0 /100 | #6 | Exceptional 8.3% |
| Immigrants | Iran | 100.0 /100 | #7 | Exceptional 8.3% |
| Burmese | 99.9 /100 | #8 | Exceptional 8.6% |
| Immigrants | Korea | 99.9 /100 | #9 | Exceptional 8.7% |
| Immigrants | South Central Asia | 99.9 /100 | #10 | Exceptional 8.8% |
| Okinawans | 99.9 /100 | #11 | Exceptional 8.9% |
| Cypriots | 99.9 /100 | #12 | Exceptional 8.9% |
| Bulgarians | 99.9 /100 | #13 | Exceptional 8.9% |
| Maltese | 99.9 /100 | #14 | Exceptional 8.9% |
| Norwegians | 99.9 /100 | #15 | Exceptional 9.0% |
| Immigrants | Japan | 99.9 /100 | #16 | Exceptional 9.0% |
| Immigrants | Scotland | 99.9 /100 | #17 | Exceptional 9.0% |
Demographics Similar to Immigrants from Congo by Receiving Food Stamps
In terms of receiving food stamps, the demographic groups most similar to Immigrants from Congo are Central American (14.1%, a difference of 0.010%), Creek (14.1%, a difference of 0.11%), Immigrants from Ghana (14.1%, a difference of 0.23%), Arapaho (14.1%, a difference of 0.31%), and Japanese (14.1%, a difference of 0.41%).
| Demographics | Rating | Rank | Receiving Food Stamps |
| Marshallese | 0.3 /100 | #254 | Tragic 14.1% |
| Sub-Saharan Africans | 0.3 /100 | #255 | Tragic 14.1% |
| Japanese | 0.3 /100 | #256 | Tragic 14.1% |
| Arapaho | 0.3 /100 | #257 | Tragic 14.1% |
| Immigrants | Ghana | 0.3 /100 | #258 | Tragic 14.1% |
| Creek | 0.3 /100 | #259 | Tragic 14.1% |
| Central Americans | 0.3 /100 | #260 | Tragic 14.1% |
| Immigrants | Congo | 0.3 /100 | #261 | Tragic 14.1% |
| Paiute | 0.2 /100 | #262 | Tragic 14.3% |
| Immigrants | Portugal | 0.2 /100 | #263 | Tragic 14.3% |
| Immigrants | Uzbekistan | 0.2 /100 | #264 | Tragic 14.3% |
| Blackfeet | 0.2 /100 | #265 | Tragic 14.3% |
| Cheyenne | 0.2 /100 | #266 | Tragic 14.3% |
| Dutch West Indians | 0.2 /100 | #267 | Tragic 14.3% |
| Guatemalans | 0.1 /100 | #268 | Tragic 14.4% |