Houma vs Maltese Receiving Food Stamps
COMPARE
Houma
Maltese
Receiving Food Stamps
Receiving Food Stamps Comparison
Houma
Maltese
16.5%
RECEIVING FOOD STAMPS
0.0/ 100
METRIC RATING
307th/ 347
METRIC RANK
8.9%
RECEIVING FOOD STAMPS
99.9/ 100
METRIC RATING
14th/ 347
METRIC RANK
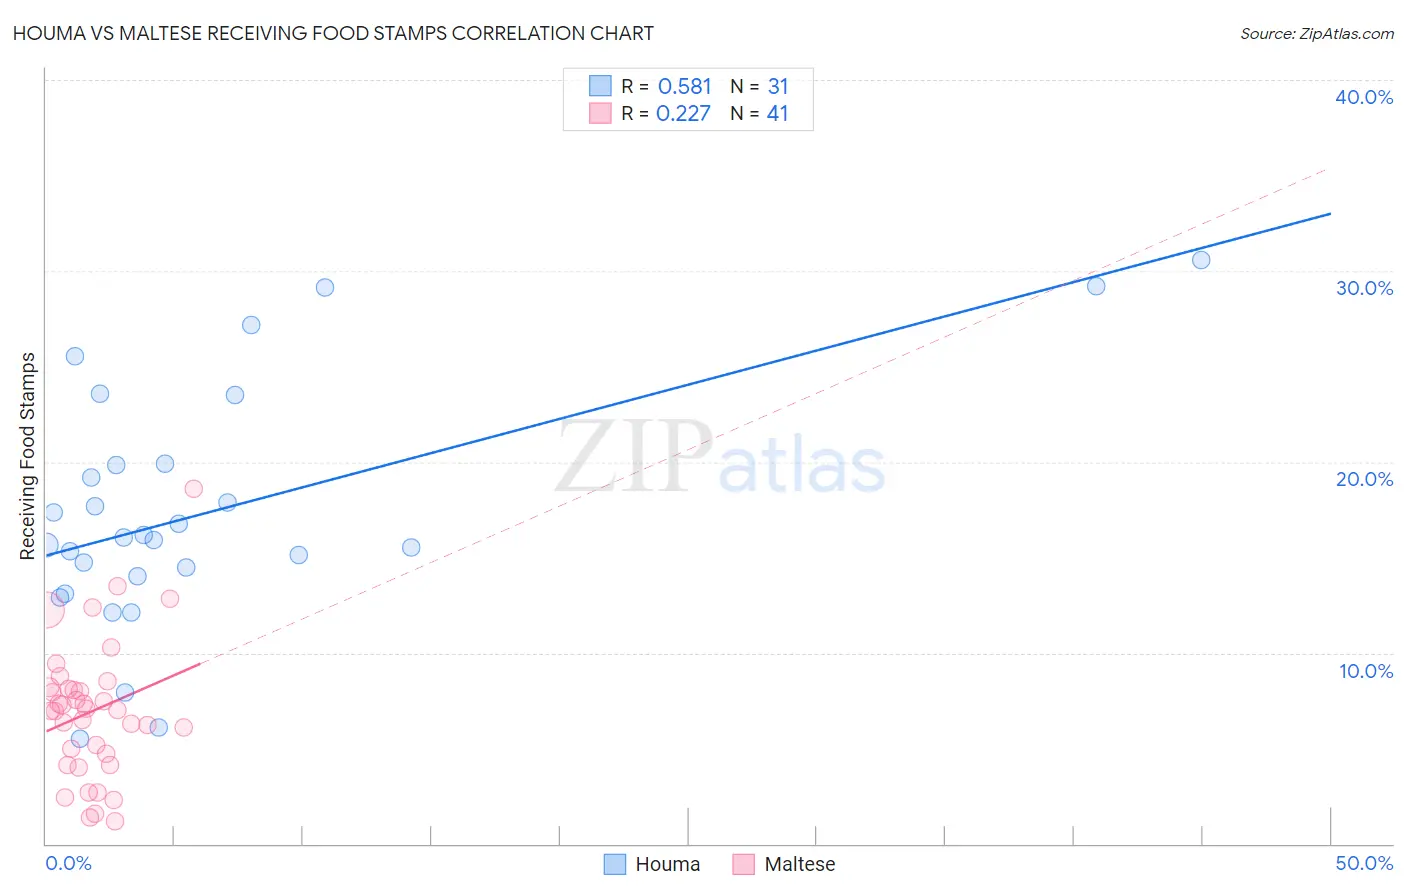
Houma vs Maltese Receiving Food Stamps Correlation Chart
The statistical analysis conducted on geographies consisting of 36,773,946 people shows a substantial positive correlation between the proportion of Houma and percentage of population receiving government assistance and/or food stamps in the United States with a correlation coefficient (R) of 0.581 and weighted average of 16.5%. Similarly, the statistical analysis conducted on geographies consisting of 126,326,632 people shows a weak positive correlation between the proportion of Maltese and percentage of population receiving government assistance and/or food stamps in the United States with a correlation coefficient (R) of 0.227 and weighted average of 8.9%, a difference of 84.9%.
Receiving Food Stamps Correlation Summary
| Measurement | Houma | Maltese |
| Minimum | 5.5% | 1.2% |
| Maximum | 30.6% | 18.6% |
| Range | 25.1% | 17.4% |
| Mean | 17.4% | 6.9% |
| Median | 16.0% | 7.0% |
| Interquartile 25% (IQ1) | 14.0% | 4.4% |
| Interquartile 75% (IQ3) | 19.9% | 8.2% |
| Interquartile Range (IQR) | 5.9% | 3.8% |
| Standard Deviation (Sample) | 6.3% | 3.6% |
| Standard Deviation (Population) | 6.2% | 3.5% |
Similar Demographics by Receiving Food Stamps
Demographics Similar to Houma by Receiving Food Stamps
In terms of receiving food stamps, the demographic groups most similar to Houma are Barbadian (16.5%, a difference of 0.26%), Jamaican (16.4%, a difference of 0.29%), Immigrants from the Azores (16.4%, a difference of 0.35%), U.S. Virgin Islander (16.5%, a difference of 0.50%), and Immigrants from Barbados (16.6%, a difference of 1.1%).
| Demographics | Rating | Rank | Receiving Food Stamps |
| Immigrants | Bangladesh | 0.0 /100 | #300 | Tragic 15.9% |
| Trinidadians and Tobagonians | 0.0 /100 | #301 | Tragic 16.0% |
| Immigrants | West Indies | 0.0 /100 | #302 | Tragic 16.1% |
| Nicaraguans | 0.0 /100 | #303 | Tragic 16.1% |
| West Indians | 0.0 /100 | #304 | Tragic 16.3% |
| Immigrants | Azores | 0.0 /100 | #305 | Tragic 16.4% |
| Jamaicans | 0.0 /100 | #306 | Tragic 16.4% |
| Houma | 0.0 /100 | #307 | Tragic 16.5% |
| Barbadians | 0.0 /100 | #308 | Tragic 16.5% |
| U.S. Virgin Islanders | 0.0 /100 | #309 | Tragic 16.5% |
| Immigrants | Barbados | 0.0 /100 | #310 | Tragic 16.6% |
| Guyanese | 0.0 /100 | #311 | Tragic 16.7% |
| Sioux | 0.0 /100 | #312 | Tragic 16.8% |
| Immigrants | Jamaica | 0.0 /100 | #313 | Tragic 16.9% |
| Immigrants | Guyana | 0.0 /100 | #314 | Tragic 16.9% |
Demographics Similar to Maltese by Receiving Food Stamps
In terms of receiving food stamps, the demographic groups most similar to Maltese are Bulgarian (8.9%, a difference of 0.13%), Okinawan (8.9%, a difference of 0.33%), Cypriot (8.9%, a difference of 0.33%), Norwegian (9.0%, a difference of 0.66%), and Immigrants from South Central Asia (8.8%, a difference of 0.77%).
| Demographics | Rating | Rank | Receiving Food Stamps |
| Immigrants | Iran | 100.0 /100 | #7 | Exceptional 8.3% |
| Burmese | 99.9 /100 | #8 | Exceptional 8.6% |
| Immigrants | Korea | 99.9 /100 | #9 | Exceptional 8.7% |
| Immigrants | South Central Asia | 99.9 /100 | #10 | Exceptional 8.8% |
| Okinawans | 99.9 /100 | #11 | Exceptional 8.9% |
| Cypriots | 99.9 /100 | #12 | Exceptional 8.9% |
| Bulgarians | 99.9 /100 | #13 | Exceptional 8.9% |
| Maltese | 99.9 /100 | #14 | Exceptional 8.9% |
| Norwegians | 99.9 /100 | #15 | Exceptional 9.0% |
| Immigrants | Japan | 99.9 /100 | #16 | Exceptional 9.0% |
| Immigrants | Scotland | 99.9 /100 | #17 | Exceptional 9.0% |
| Danes | 99.9 /100 | #18 | Exceptional 9.0% |
| Immigrants | Hong Kong | 99.8 /100 | #19 | Exceptional 9.1% |
| Latvians | 99.8 /100 | #20 | Exceptional 9.1% |
| Luxembourgers | 99.8 /100 | #21 | Exceptional 9.1% |