Immigrants from West Indies vs Immigrants from Congo Receiving Food Stamps
COMPARE
Immigrants from West Indies
Immigrants from Congo
Receiving Food Stamps
Receiving Food Stamps Comparison
Immigrants from West Indies
Immigrants from Congo
16.1%
RECEIVING FOOD STAMPS
0.0/ 100
METRIC RATING
302nd/ 347
METRIC RANK
14.1%
RECEIVING FOOD STAMPS
0.3/ 100
METRIC RATING
261st/ 347
METRIC RANK
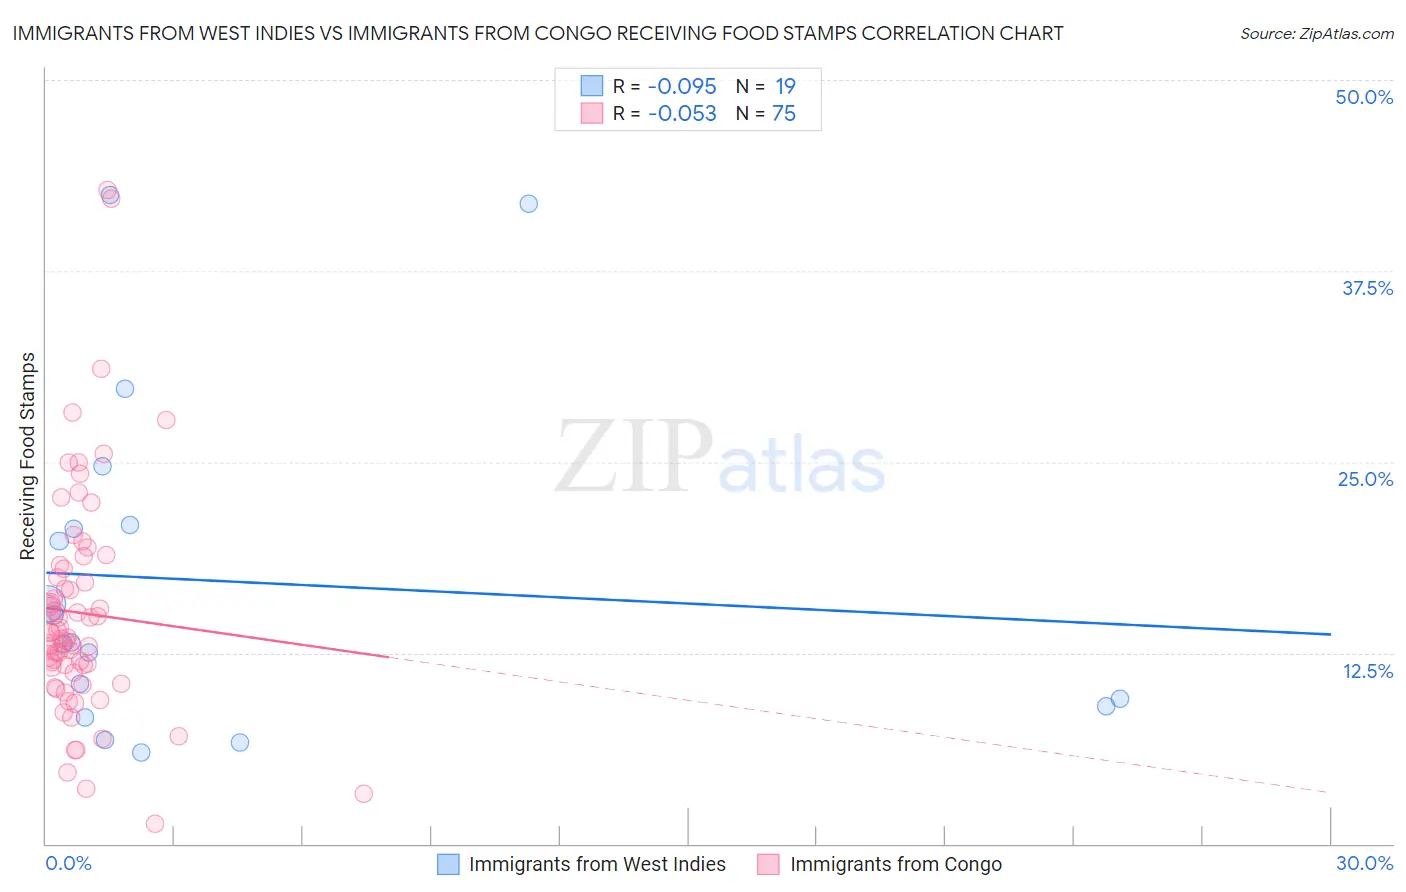
Immigrants from West Indies vs Immigrants from Congo Receiving Food Stamps Correlation Chart
The statistical analysis conducted on geographies consisting of 72,442,413 people shows a slight negative correlation between the proportion of Immigrants from West Indies and percentage of population receiving government assistance and/or food stamps in the United States with a correlation coefficient (R) of -0.095 and weighted average of 16.1%. Similarly, the statistical analysis conducted on geographies consisting of 92,058,964 people shows a slight negative correlation between the proportion of Immigrants from Congo and percentage of population receiving government assistance and/or food stamps in the United States with a correlation coefficient (R) of -0.053 and weighted average of 14.1%, a difference of 14.0%.
Receiving Food Stamps Correlation Summary
| Measurement | Immigrants from West Indies | Immigrants from Congo |
| Minimum | 6.0% | 1.3% |
| Maximum | 42.5% | 42.8% |
| Range | 36.5% | 41.5% |
| Mean | 17.2% | 15.1% |
| Median | 13.1% | 13.5% |
| Interquartile 25% (IQ1) | 9.0% | 11.2% |
| Interquartile 75% (IQ3) | 20.9% | 18.0% |
| Interquartile Range (IQR) | 11.9% | 6.8% |
| Standard Deviation (Sample) | 10.9% | 7.4% |
| Standard Deviation (Population) | 10.7% | 7.4% |
Similar Demographics by Receiving Food Stamps
Demographics Similar to Immigrants from West Indies by Receiving Food Stamps
In terms of receiving food stamps, the demographic groups most similar to Immigrants from West Indies are Nicaraguan (16.1%, a difference of 0.090%), West Indian (16.3%, a difference of 0.77%), Trinidadian and Tobagonian (16.0%, a difference of 0.94%), Immigrants from Bangladesh (15.9%, a difference of 1.4%), and Immigrants from the Azores (16.4%, a difference of 1.7%).
| Demographics | Rating | Rank | Receiving Food Stamps |
| Immigrants | Honduras | 0.0 /100 | #295 | Tragic 15.7% |
| Tsimshian | 0.0 /100 | #296 | Tragic 15.7% |
| Immigrants | Bahamas | 0.0 /100 | #297 | Tragic 15.8% |
| Immigrants | Trinidad and Tobago | 0.0 /100 | #298 | Tragic 15.8% |
| Hispanics or Latinos | 0.0 /100 | #299 | Tragic 15.8% |
| Immigrants | Bangladesh | 0.0 /100 | #300 | Tragic 15.9% |
| Trinidadians and Tobagonians | 0.0 /100 | #301 | Tragic 16.0% |
| Immigrants | West Indies | 0.0 /100 | #302 | Tragic 16.1% |
| Nicaraguans | 0.0 /100 | #303 | Tragic 16.1% |
| West Indians | 0.0 /100 | #304 | Tragic 16.3% |
| Immigrants | Azores | 0.0 /100 | #305 | Tragic 16.4% |
| Jamaicans | 0.0 /100 | #306 | Tragic 16.4% |
| Houma | 0.0 /100 | #307 | Tragic 16.5% |
| Barbadians | 0.0 /100 | #308 | Tragic 16.5% |
| U.S. Virgin Islanders | 0.0 /100 | #309 | Tragic 16.5% |
Demographics Similar to Immigrants from Congo by Receiving Food Stamps
In terms of receiving food stamps, the demographic groups most similar to Immigrants from Congo are Central American (14.1%, a difference of 0.010%), Creek (14.1%, a difference of 0.11%), Immigrants from Ghana (14.1%, a difference of 0.23%), Arapaho (14.1%, a difference of 0.31%), and Japanese (14.1%, a difference of 0.41%).
| Demographics | Rating | Rank | Receiving Food Stamps |
| Marshallese | 0.3 /100 | #254 | Tragic 14.1% |
| Sub-Saharan Africans | 0.3 /100 | #255 | Tragic 14.1% |
| Japanese | 0.3 /100 | #256 | Tragic 14.1% |
| Arapaho | 0.3 /100 | #257 | Tragic 14.1% |
| Immigrants | Ghana | 0.3 /100 | #258 | Tragic 14.1% |
| Creek | 0.3 /100 | #259 | Tragic 14.1% |
| Central Americans | 0.3 /100 | #260 | Tragic 14.1% |
| Immigrants | Congo | 0.3 /100 | #261 | Tragic 14.1% |
| Paiute | 0.2 /100 | #262 | Tragic 14.3% |
| Immigrants | Portugal | 0.2 /100 | #263 | Tragic 14.3% |
| Immigrants | Uzbekistan | 0.2 /100 | #264 | Tragic 14.3% |
| Blackfeet | 0.2 /100 | #265 | Tragic 14.3% |
| Cheyenne | 0.2 /100 | #266 | Tragic 14.3% |
| Dutch West Indians | 0.2 /100 | #267 | Tragic 14.3% |
| Guatemalans | 0.1 /100 | #268 | Tragic 14.4% |