Immigrants from India vs Czechoslovakian Single Father Poverty
COMPARE
Immigrants from India
Czechoslovakian
Single Father Poverty
Single Father Poverty Comparison
Immigrants from India
Czechoslovakians
14.0%
SINGLE FATHER POVERTY
100.0/ 100
METRIC RATING
12th/ 347
METRIC RANK
17.1%
SINGLE FATHER POVERTY
1.3/ 100
METRIC RATING
248th/ 347
METRIC RANK
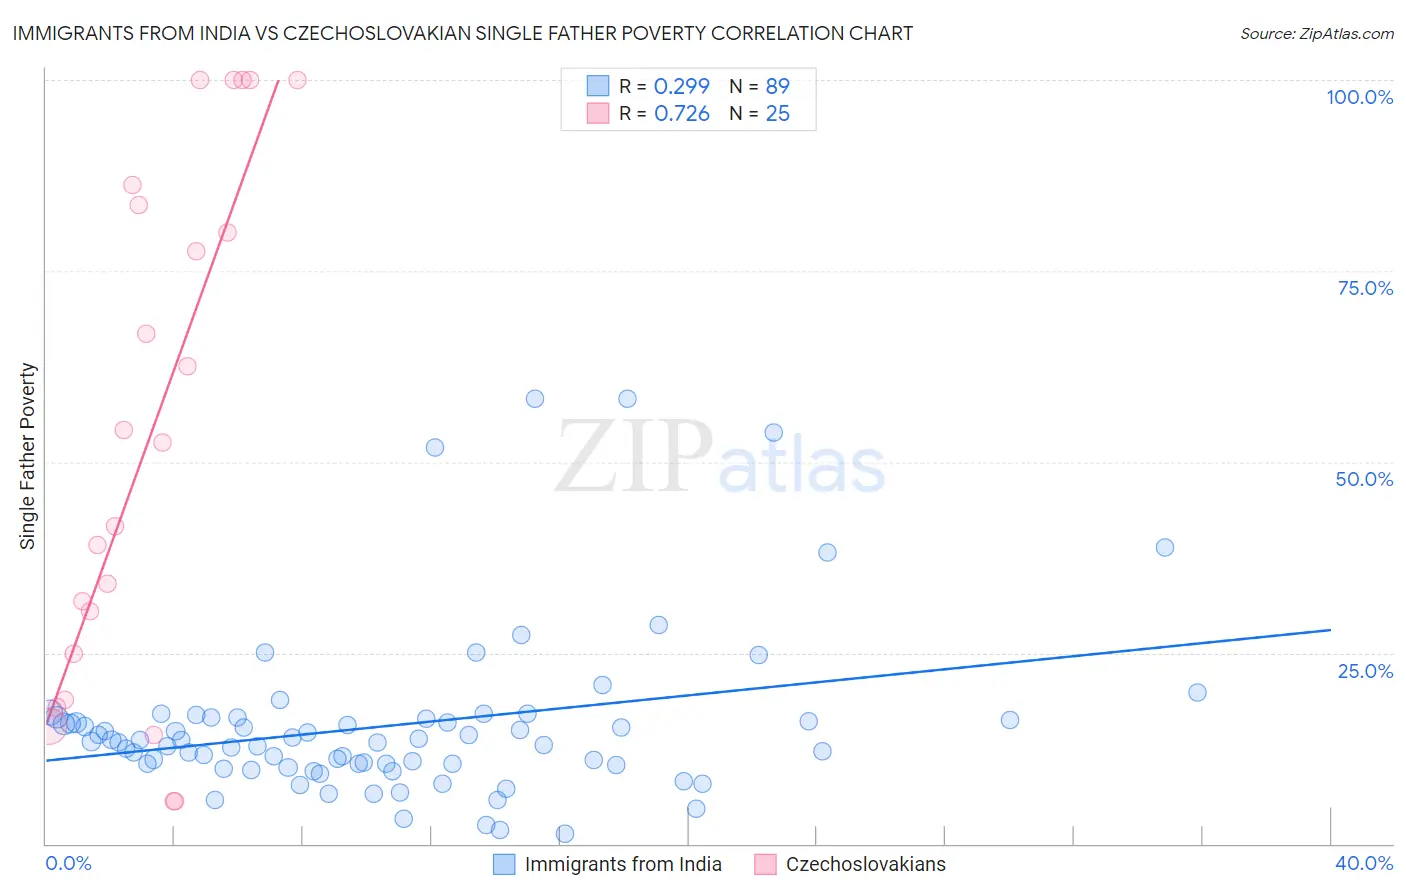
Immigrants from India vs Czechoslovakian Single Father Poverty Correlation Chart
The statistical analysis conducted on geographies consisting of 333,180,346 people shows a weak positive correlation between the proportion of Immigrants from India and poverty level among single fathers in the United States with a correlation coefficient (R) of 0.299 and weighted average of 14.0%. Similarly, the statistical analysis conducted on geographies consisting of 285,091,389 people shows a strong positive correlation between the proportion of Czechoslovakians and poverty level among single fathers in the United States with a correlation coefficient (R) of 0.726 and weighted average of 17.1%, a difference of 21.7%.
Single Father Poverty Correlation Summary
| Measurement | Immigrants from India | Czechoslovakian |
| Minimum | 1.4% | 5.5% |
| Maximum | 58.3% | 100.0% |
| Range | 56.9% | 94.5% |
| Mean | 15.5% | 53.7% |
| Median | 13.3% | 52.6% |
| Interquartile 25% (IQ1) | 10.4% | 21.8% |
| Interquartile 75% (IQ3) | 16.5% | 85.0% |
| Interquartile Range (IQR) | 6.0% | 63.1% |
| Standard Deviation (Sample) | 10.8% | 33.5% |
| Standard Deviation (Population) | 10.8% | 32.8% |
Similar Demographics by Single Father Poverty
Demographics Similar to Immigrants from India by Single Father Poverty
In terms of single father poverty, the demographic groups most similar to Immigrants from India are Filipino (14.0%, a difference of 0.0%), Immigrants from Philippines (14.0%, a difference of 0.15%), Korean (14.0%, a difference of 0.41%), Afghan (14.0%, a difference of 0.51%), and Immigrants from Vietnam (14.1%, a difference of 0.85%).
| Demographics | Rating | Rank | Single Father Poverty |
| Immigrants | Ethiopia | 100.0 /100 | #5 | Exceptional 13.4% |
| Ethiopians | 100.0 /100 | #6 | Exceptional 13.5% |
| Immigrants | Taiwan | 100.0 /100 | #7 | Exceptional 13.7% |
| Samoans | 100.0 /100 | #8 | Exceptional 13.8% |
| Afghans | 100.0 /100 | #9 | Exceptional 14.0% |
| Koreans | 100.0 /100 | #10 | Exceptional 14.0% |
| Filipinos | 100.0 /100 | #11 | Exceptional 14.0% |
| Immigrants | India | 100.0 /100 | #12 | Exceptional 14.0% |
| Immigrants | Philippines | 100.0 /100 | #13 | Exceptional 14.0% |
| Immigrants | Vietnam | 100.0 /100 | #14 | Exceptional 14.1% |
| Sri Lankans | 100.0 /100 | #15 | Exceptional 14.2% |
| Immigrants | Iran | 100.0 /100 | #16 | Exceptional 14.2% |
| Immigrants | Hong Kong | 100.0 /100 | #17 | Exceptional 14.2% |
| Soviet Union | 100.0 /100 | #18 | Exceptional 14.3% |
| Immigrants | Iraq | 100.0 /100 | #19 | Exceptional 14.3% |
Demographics Similar to Czechoslovakians by Single Father Poverty
In terms of single father poverty, the demographic groups most similar to Czechoslovakians are Greek (17.1%, a difference of 0.0%), Canadian (17.1%, a difference of 0.040%), Immigrants from Ireland (17.1%, a difference of 0.10%), Trinidadian and Tobagonian (17.0%, a difference of 0.14%), and Austrian (17.1%, a difference of 0.17%).
| Demographics | Rating | Rank | Single Father Poverty |
| Czechs | 2.3 /100 | #241 | Tragic 17.0% |
| Moroccans | 2.1 /100 | #242 | Tragic 17.0% |
| Immigrants | Cabo Verde | 1.6 /100 | #243 | Tragic 17.0% |
| Hondurans | 1.6 /100 | #244 | Tragic 17.0% |
| Trinidadians and Tobagonians | 1.5 /100 | #245 | Tragic 17.0% |
| Immigrants | Ireland | 1.4 /100 | #246 | Tragic 17.1% |
| Greeks | 1.3 /100 | #247 | Tragic 17.1% |
| Czechoslovakians | 1.3 /100 | #248 | Tragic 17.1% |
| Canadians | 1.3 /100 | #249 | Tragic 17.1% |
| Austrians | 1.1 /100 | #250 | Tragic 17.1% |
| Luxembourgers | 1.1 /100 | #251 | Tragic 17.1% |
| Croatians | 1.0 /100 | #252 | Tragic 17.1% |
| Cree | 1.0 /100 | #253 | Tragic 17.1% |
| Immigrants | Honduras | 0.9 /100 | #254 | Tragic 17.1% |
| Sierra Leoneans | 0.8 /100 | #255 | Tragic 17.2% |