Honduran vs Native Hawaiian Single Mother Poverty

COMPARE

Honduran
Race
Ancestry
AfghanAfricanAlaska NativeAlaskan AthabascanAlbanianAleutAlsatianAmericanApacheArabArapahoArgentineanArmenianAssyrian/Chaldean/SyriacAustralianAustrianBahamianBangladeshiBarbadianBasqueBelgianBelizeanBermudanBhutaneseBlackfeetBolivianBrazilianBritishBritish West IndianBulgarianBurmeseCajunCambodianCanadianCape VerdeanCarpatho RusynCelticCentral AmericanCentral American IndianCherokeeCheyenneChickasawChileanChineseChippewaChoctawColombianColvilleComancheCosta RicanCreeCreekCroatianCrowCubanCypriotCzechCzechoslovakianDanishDelawareDominicanDutchDutch West IndianEastern EuropeanEcuadorianEgyptianEnglishEstonianEthiopianEuropeanFijianFilipinoFinnishFrenchFrench American IndianFrench CanadianGermanGerman RussianGhanaianGreekGuamanian/ChamorroGuatemalanGuyaneseHaitianHmongHonduranHopiHoumaHungarianIcelanderIndian (Asian)IndonesianInupiatIranianIraqiIrishIroquoisIsraeliItalianJamaicanJapaneseJordanianKenyanKiowaKoreanLaotianLatvianLebaneseLiberianLithuanianLumbeeLuxembourgerMacedonianMalaysianMalteseMarshalleseMenomineeMexicanMexican American IndianMongolianMoroccanNavajoNepaleseNew ZealanderNicaraguanNigerianNorthern EuropeanNorwegianOkinawanOsageOttawaPaiutePakistaniPalestinianPanamanianParaguayanPennsylvania GermanPeruvianPimaPolishPortuguesePotawatomiPuebloPuerto RicanPuget Sound SalishRomanianRussianSalvadoranSamoanScandinavianScotch-IrishScottishSeminoleSenegaleseSerbianShoshoneSierra LeoneanSiouxSlavicSlovakSloveneSomaliSouth AfricanSouth AmericanSouth American IndianSoviet UnionSpaniardSpanishSpanish AmericanSpanish American IndianSri LankanSubsaharan AfricanSudaneseSwedishSwissSyrianTaiwaneseThaiTlingit-HaidaTohono O'OdhamTonganTrinidadian and TobagonianTsimshianTurkishU.S. Virgin IslanderUgandanUkrainianUruguayanUteVenezuelanVietnameseWelshWest IndianYakamaYaquiYugoslavianYumanYup'ikZimbabwean
Immigration
NonimmigrantsImmigrantsAfghanistanAfricaAlbaniaArgentinaArmeniaAsiaAustraliaAustriaBahamasBangladeshBarbadosBelarusBelgiumBelizeBoliviaBosnia and HerzegovinaBrazilBulgariaBurma/MyanmarCabo VerdeCambodiaCameroonCanadaCaribbeanCentral AmericaChileChinaColombiaCongoCosta RicaCroatiaCubaCzechoslovakiaDenmarkDominicaDominican RepublicEastern AfricaEastern AsiaEastern EuropeEcuadorEgyptEl SalvadorEnglandEritreaEthiopiaEuropeFijiFranceGermanyGhanaGreeceGrenadaGuatemalaGuyanaHaitiHondurasHong KongHungaryIndiaIndonesiaIranIraqIrelandIsraelItalyJamaicaJapanJordanKazakhstanKenyaKoreaKuwaitLaosLatin AmericaLatviaLebanonLiberiaLithuaniaMalaysiaMexicoMicronesiaMiddle AfricaMoldovaMoroccoNepalNetherlandsNicaraguaNigeriaNorth AmericaNorth MacedoniaNorthern AfricaNorthern EuropeNorwayOceaniaPakistanPanamaPeruPhilippinesPolandPortugalRomaniaRussiaSaudi ArabiaScotlandSenegalSerbiaSierra LeoneSingaporeSomaliaSouth AfricaSouth AmericaSouth Central AsiaSouth Eastern AsiaSouthern EuropeSpainSri LankaSt. Vincent and the GrenadinesSudanSwedenSwitzerlandSyriaTaiwanThailandTrinidad and TobagoTurkeyUgandaUkraineUruguayUzbekistanVenezuelaVietnamWest IndiesWestern AfricaWestern AsiaWestern EuropeYemenZaireZimbabweAzores
Native Hawaiian
Race
Ancestry
AfghanAfricanAlaska NativeAlaskan AthabascanAlbanianAleutAlsatianAmericanApacheArabArapahoArgentineanArmenianAssyrian/Chaldean/SyriacAustralianAustrianBahamianBangladeshiBarbadianBasqueBelgianBelizeanBermudanBhutaneseBlackfeetBolivianBrazilianBritishBritish West IndianBulgarianBurmeseCajunCambodianCanadianCape VerdeanCarpatho RusynCelticCentral AmericanCentral American IndianCherokeeCheyenneChickasawChileanChineseChippewaChoctawColombianColvilleComancheCosta RicanCreeCreekCroatianCrowCubanCypriotCzechCzechoslovakianDanishDelawareDominicanDutchDutch West IndianEastern EuropeanEcuadorianEgyptianEnglishEstonianEthiopianEuropeanFijianFilipinoFinnishFrenchFrench American IndianFrench CanadianGermanGerman RussianGhanaianGreekGuamanian/ChamorroGuatemalanGuyaneseHaitianHmongHopiHoumaHungarianIcelanderIndian (Asian)IndonesianInupiatIranianIraqiIrishIroquoisIsraeliItalianJamaicanJapaneseJordanianKenyanKiowaKoreanLaotianLatvianLebaneseLiberianLithuanianLumbeeLuxembourgerMacedonianMalaysianMalteseMarshalleseMenomineeMexicanMexican American IndianMongolianMoroccanNative HawaiianNavajoNepaleseNew ZealanderNicaraguanNigerianNorthern EuropeanNorwegianOkinawanOsageOttawaPaiutePakistaniPalestinianPanamanianParaguayanPennsylvania GermanPeruvianPimaPolishPortuguesePotawatomiPuebloPuerto RicanPuget Sound SalishRomanianRussianSalvadoranSamoanScandinavianScotch-IrishScottishSeminoleSenegaleseSerbianShoshoneSierra LeoneanSiouxSlavicSlovakSloveneSomaliSouth AfricanSouth AmericanSouth American IndianSoviet UnionSpaniardSpanishSpanish AmericanSpanish American IndianSri LankanSubsaharan AfricanSudaneseSwedishSwissSyrianTaiwaneseThaiTlingit-HaidaTohono O'OdhamTonganTrinidadian and TobagonianTsimshianTurkishU.S. Virgin IslanderUgandanUkrainianUruguayanUteVenezuelanVietnameseWelshWest IndianYakamaYaquiYugoslavianYumanYup'ikZimbabwean
Immigration
NonimmigrantsImmigrantsAfghanistanAfricaAlbaniaArgentinaArmeniaAsiaAustraliaAustriaBahamasBangladeshBarbadosBelarusBelgiumBelizeBoliviaBosnia and HerzegovinaBrazilBulgariaBurma/MyanmarCabo VerdeCambodiaCameroonCanadaCaribbeanCentral AmericaChileChinaColombiaCongoCosta RicaCroatiaCubaCzechoslovakiaDenmarkDominicaDominican RepublicEastern AfricaEastern AsiaEastern EuropeEcuadorEgyptEl SalvadorEnglandEritreaEthiopiaEuropeFijiFranceGermanyGhanaGreeceGrenadaGuatemalaGuyanaHaitiHondurasHong KongHungaryIndiaIndonesiaIranIraqIrelandIsraelItalyJamaicaJapanJordanKazakhstanKenyaKoreaKuwaitLaosLatin AmericaLatviaLebanonLiberiaLithuaniaMalaysiaMexicoMicronesiaMiddle AfricaMoldovaMoroccoNepalNetherlandsNicaraguaNigeriaNorth AmericaNorth MacedoniaNorthern AfricaNorthern EuropeNorwayOceaniaPakistanPanamaPeruPhilippinesPolandPortugalRomaniaRussiaSaudi ArabiaScotlandSenegalSerbiaSierra LeoneSingaporeSomaliaSouth AfricaSouth AmericaSouth Central AsiaSouth Eastern AsiaSouthern EuropeSpainSri LankaSt. Vincent and the GrenadinesSudanSwedenSwitzerlandSyriaTaiwanThailandTrinidad and TobagoTurkeyUgandaUkraineUruguayUzbekistanVenezuelaVietnamWest IndiesWestern AfricaWestern AsiaWestern EuropeYemenZaireZimbabweAzores
Single Mother Poverty
Income
Poverty
Unemployment
Labor Participation
Family Structure
Vehicle Availability
Education Level
Disability

Single Mother Poverty Comparison

Hondurans

Native Hawaiians

Tragic
Excellent
34.2%
SINGLE MOTHER POVERTY
0.0/ 100
METRIC RATING
310th/ 347
METRIC RANK
28.4%
SINGLE MOTHER POVERTY
88.9/ 100
METRIC RATING
136th/ 347
METRIC RANK

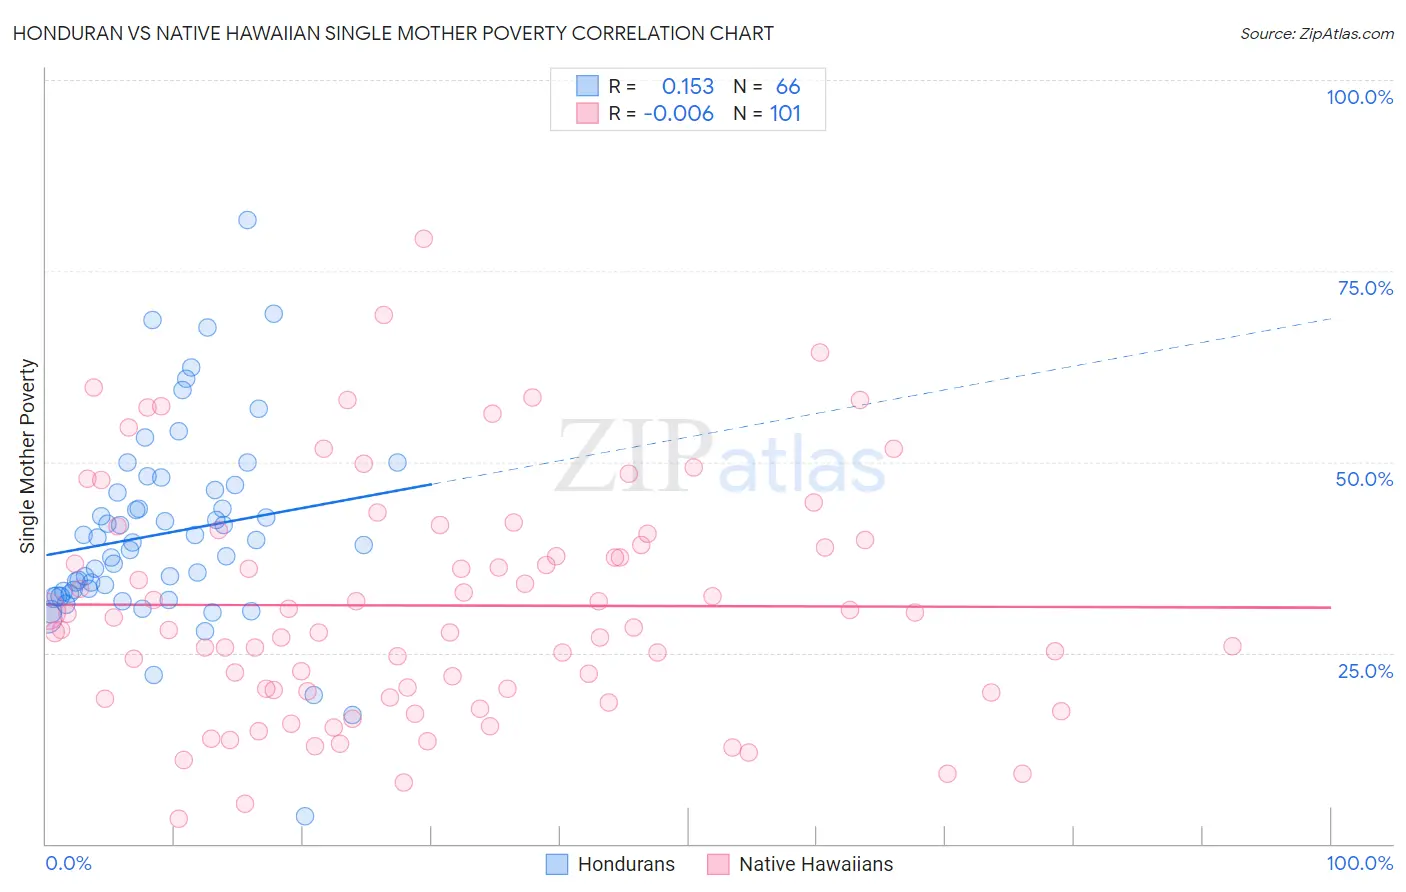
Honduran vs Native Hawaiian Single Mother Poverty Correlation Chart

The statistical analysis conducted on geographies consisting of 352,983,929 people shows a poor positive correlation between the proportion of Hondurans and poverty level among single mothers in the United States with a correlation coefficient (R) of 0.153 and weighted average of 34.2%. Similarly, the statistical analysis conducted on geographies consisting of 326,645,581 people shows no correlation between the proportion of Native Hawaiians and poverty level among single mothers in the United States with a correlation coefficient (R) of -0.006 and weighted average of 28.4%, a difference of 20.3%.
Honduran vs Native Hawaiian Single Mother Poverty

Single Mother Poverty Correlation Summary

MeasurementHonduranNative Hawaiian
Minimum3.6%3.3%
Maximum81.7%79.2%
Range78.2%75.9%
Mean40.6%31.2%
Median39.2%28.4%
Interquartile 25% (IQ1)32.8%19.8%
Interquartile 75% (IQ3)46.3%40.2%
Interquartile Range (IQR)13.5%20.4%
Standard Deviation (Sample)12.9%15.3%
Standard Deviation (Population)12.8%15.3%

Similar Demographics by Single Mother Poverty

Demographics Similar to Hondurans by Single Mother Poverty

In terms of single mother poverty, the demographic groups most similar to Hondurans are Potawatomi (34.1%, a difference of 0.22%), Alsatian (34.3%, a difference of 0.31%), Central American Indian (34.3%, a difference of 0.39%), Immigrants from Dominican Republic (34.4%, a difference of 0.47%), and Immigrants from Mexico (34.0%, a difference of 0.64%).
DemographicsRating | RankSingle Mother Poverty
Americans
0.0
/100
|
#303
Tragic
33.5%
Mexicans
0.0
/100
|
#304
Tragic
33.6%
Immigrants | Central America
0.0
/100
|
#305
Tragic
33.6%
Immigrants | Congo
0.0
/100
|
#306
Tragic
33.8%
Comanche
0.0
/100
|
#307
Tragic
33.9%
Immigrants | Mexico
0.0
/100
|
#308
Tragic
34.0%
Potawatomi
0.0
/100
|
#309
Tragic
34.1%
Hondurans
0.0
/100
|
#310
Tragic
34.2%
Alsatians
0.0
/100
|
#311
Tragic
34.3%
Central American Indians
0.0
/100
|
#312
Tragic
34.3%
Immigrants | Dominican Republic
0.0
/100
|
#313
Tragic
34.4%
Chickasaw
0.0
/100
|
#314
Tragic
34.4%
Hopi
0.0
/100
|
#315
Tragic
34.5%
Dominicans
0.0
/100
|
#316
Tragic
34.5%
Cherokee
0.0
/100
|
#317
Tragic
34.5%

Demographics Similar to Native Hawaiians by Single Mother Poverty

In terms of single mother poverty, the demographic groups most similar to Native Hawaiians are Immigrants from Canada (28.4%, a difference of 0.0%), Immigrants from Southern Europe (28.4%, a difference of 0.040%), Immigrants from Spain (28.4%, a difference of 0.040%), Immigrants from Belgium (28.5%, a difference of 0.050%), and Swedish (28.4%, a difference of 0.060%).
DemographicsRating | RankSingle Mother Poverty
South Americans
90.4
/100
|
#129
Exceptional
28.4%
Norwegians
90.4
/100
|
#130
Exceptional
28.4%
Immigrants | Austria
90.3
/100
|
#131
Exceptional
28.4%
Immigrants | Morocco
89.5
/100
|
#132
Excellent
28.4%
Swedes
89.4
/100
|
#133
Excellent
28.4%
Immigrants | Southern Europe
89.2
/100
|
#134
Excellent
28.4%
Immigrants | Spain
89.2
/100
|
#135
Excellent
28.4%
Native Hawaiians
88.9
/100
|
#136
Excellent
28.4%
Immigrants | Canada
88.9
/100
|
#137
Excellent
28.4%
Immigrants | Belgium
88.5
/100
|
#138
Excellent
28.5%
Samoans
88.1
/100
|
#139
Excellent
28.5%
Immigrants | Colombia
88.0
/100
|
#140
Excellent
28.5%
Danes
87.1
/100
|
#141
Excellent
28.5%
South Africans
86.6
/100
|
#142
Excellent
28.5%
Immigrants | North America
86.5
/100
|
#143
Excellent
28.5%