Immigrants from Fiji vs Native Hawaiian Single Mother Poverty
COMPARE
Immigrants from Fiji
Native Hawaiian
Single Mother Poverty
Single Mother Poverty Comparison
Immigrants from Fiji
Native Hawaiians
26.6%
SINGLE MOTHER POVERTY
99.9/ 100
METRIC RATING
38th/ 347
METRIC RANK
28.4%
SINGLE MOTHER POVERTY
88.9/ 100
METRIC RATING
136th/ 347
METRIC RANK
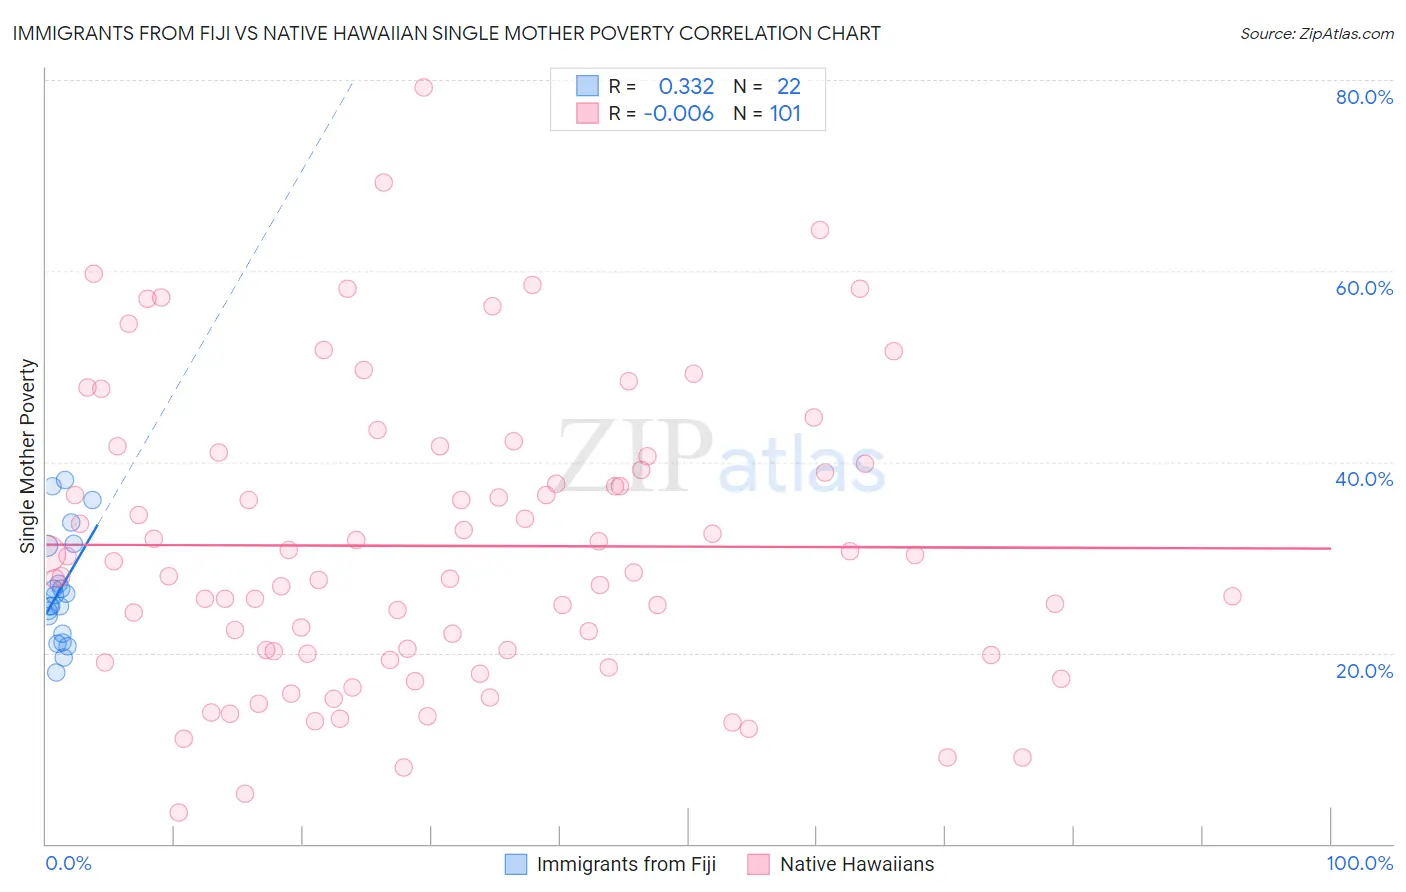
Immigrants from Fiji vs Native Hawaiian Single Mother Poverty Correlation Chart
The statistical analysis conducted on geographies consisting of 93,178,948 people shows a mild positive correlation between the proportion of Immigrants from Fiji and poverty level among single mothers in the United States with a correlation coefficient (R) of 0.332 and weighted average of 26.6%. Similarly, the statistical analysis conducted on geographies consisting of 326,645,581 people shows no correlation between the proportion of Native Hawaiians and poverty level among single mothers in the United States with a correlation coefficient (R) of -0.006 and weighted average of 28.4%, a difference of 6.9%.
Single Mother Poverty Correlation Summary
| Measurement | Immigrants from Fiji | Native Hawaiian |
| Minimum | 18.0% | 3.3% |
| Maximum | 38.1% | 79.2% |
| Range | 20.1% | 75.9% |
| Mean | 26.6% | 31.2% |
| Median | 25.5% | 28.4% |
| Interquartile 25% (IQ1) | 22.0% | 19.8% |
| Interquartile 75% (IQ3) | 31.2% | 40.2% |
| Interquartile Range (IQR) | 9.2% | 20.4% |
| Standard Deviation (Sample) | 5.8% | 15.3% |
| Standard Deviation (Population) | 5.6% | 15.3% |
Similar Demographics by Single Mother Poverty
Demographics Similar to Immigrants from Fiji by Single Mother Poverty
In terms of single mother poverty, the demographic groups most similar to Immigrants from Fiji are Okinawan (26.6%, a difference of 0.040%), Immigrants from Israel (26.6%, a difference of 0.040%), Maltese (26.6%, a difference of 0.090%), Immigrants from Indonesia (26.6%, a difference of 0.21%), and Bulgarian (26.5%, a difference of 0.22%).
| Demographics | Rating | Rank | Single Mother Poverty |
| Immigrants | Philippines | 100.0 /100 | #31 | Exceptional 26.5% |
| Tongans | 99.9 /100 | #32 | Exceptional 26.5% |
| Bulgarians | 99.9 /100 | #33 | Exceptional 26.5% |
| Immigrants | Indonesia | 99.9 /100 | #34 | Exceptional 26.6% |
| Maltese | 99.9 /100 | #35 | Exceptional 26.6% |
| Okinawans | 99.9 /100 | #36 | Exceptional 26.6% |
| Immigrants | Israel | 99.9 /100 | #37 | Exceptional 26.6% |
| Immigrants | Fiji | 99.9 /100 | #38 | Exceptional 26.6% |
| Sri Lankans | 99.9 /100 | #39 | Exceptional 26.7% |
| Immigrants | Vietnam | 99.9 /100 | #40 | Exceptional 26.7% |
| Immigrants | Greece | 99.9 /100 | #41 | Exceptional 26.7% |
| Armenians | 99.9 /100 | #42 | Exceptional 26.8% |
| Tsimshian | 99.9 /100 | #43 | Exceptional 26.8% |
| Immigrants | Sierra Leone | 99.9 /100 | #44 | Exceptional 26.9% |
| Latvians | 99.9 /100 | #45 | Exceptional 26.9% |
Demographics Similar to Native Hawaiians by Single Mother Poverty
In terms of single mother poverty, the demographic groups most similar to Native Hawaiians are Immigrants from Canada (28.4%, a difference of 0.0%), Immigrants from Southern Europe (28.4%, a difference of 0.040%), Immigrants from Spain (28.4%, a difference of 0.040%), Immigrants from Belgium (28.5%, a difference of 0.050%), and Swedish (28.4%, a difference of 0.060%).
| Demographics | Rating | Rank | Single Mother Poverty |
| South Americans | 90.4 /100 | #129 | Exceptional 28.4% |
| Norwegians | 90.4 /100 | #130 | Exceptional 28.4% |
| Immigrants | Austria | 90.3 /100 | #131 | Exceptional 28.4% |
| Immigrants | Morocco | 89.5 /100 | #132 | Excellent 28.4% |
| Swedes | 89.4 /100 | #133 | Excellent 28.4% |
| Immigrants | Southern Europe | 89.2 /100 | #134 | Excellent 28.4% |
| Immigrants | Spain | 89.2 /100 | #135 | Excellent 28.4% |
| Native Hawaiians | 88.9 /100 | #136 | Excellent 28.4% |
| Immigrants | Canada | 88.9 /100 | #137 | Excellent 28.4% |
| Immigrants | Belgium | 88.5 /100 | #138 | Excellent 28.5% |
| Samoans | 88.1 /100 | #139 | Excellent 28.5% |
| Immigrants | Colombia | 88.0 /100 | #140 | Excellent 28.5% |
| Danes | 87.1 /100 | #141 | Excellent 28.5% |
| South Africans | 86.6 /100 | #142 | Excellent 28.5% |
| Immigrants | North America | 86.5 /100 | #143 | Excellent 28.5% |