Cypriot vs Native Hawaiian Single Mother Poverty
COMPARE
Cypriot
Native Hawaiian
Single Mother Poverty
Single Mother Poverty Comparison
Cypriots
Native Hawaiians
28.3%
SINGLE MOTHER POVERTY
92.3/ 100
METRIC RATING
120th/ 347
METRIC RANK
28.4%
SINGLE MOTHER POVERTY
88.9/ 100
METRIC RATING
136th/ 347
METRIC RANK
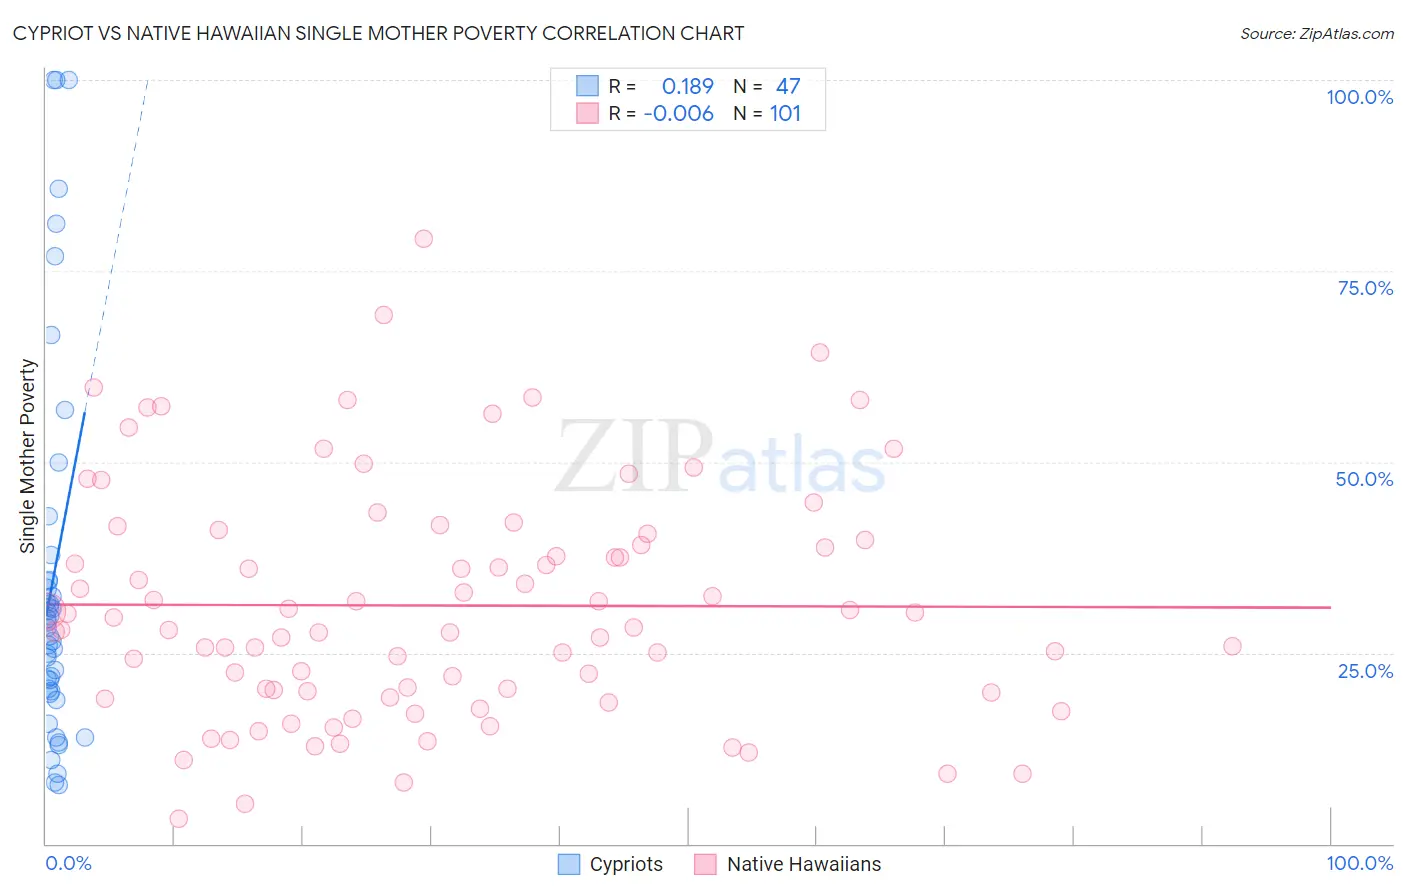
Cypriot vs Native Hawaiian Single Mother Poverty Correlation Chart
The statistical analysis conducted on geographies consisting of 61,106,831 people shows a poor positive correlation between the proportion of Cypriots and poverty level among single mothers in the United States with a correlation coefficient (R) of 0.189 and weighted average of 28.3%. Similarly, the statistical analysis conducted on geographies consisting of 326,645,581 people shows no correlation between the proportion of Native Hawaiians and poverty level among single mothers in the United States with a correlation coefficient (R) of -0.006 and weighted average of 28.4%, a difference of 0.49%.
Single Mother Poverty Correlation Summary
| Measurement | Cypriot | Native Hawaiian |
| Minimum | 7.7% | 3.3% |
| Maximum | 100.0% | 79.2% |
| Range | 92.3% | 75.9% |
| Mean | 34.7% | 31.2% |
| Median | 28.2% | 28.4% |
| Interquartile 25% (IQ1) | 20.0% | 19.8% |
| Interquartile 75% (IQ3) | 34.6% | 40.2% |
| Interquartile Range (IQR) | 14.7% | 20.4% |
| Standard Deviation (Sample) | 24.8% | 15.3% |
| Standard Deviation (Population) | 24.5% | 15.3% |
Demographics Similar to Cypriots and Native Hawaiians by Single Mother Poverty
In terms of single mother poverty, the demographic groups most similar to Cypriots are Immigrants from Syria (28.3%, a difference of 0.020%), Brazilian (28.3%, a difference of 0.030%), Immigrants from Afghanistan (28.3%, a difference of 0.040%), Colombian (28.3%, a difference of 0.090%), and Uruguayan (28.3%, a difference of 0.10%). Similarly, the demographic groups most similar to Native Hawaiians are Immigrants from Canada (28.4%, a difference of 0.0%), Immigrants from Southern Europe (28.4%, a difference of 0.040%), Immigrants from Spain (28.4%, a difference of 0.040%), Immigrants from Belgium (28.5%, a difference of 0.050%), and Swedish (28.4%, a difference of 0.060%).
| Demographics | Rating | Rank | Single Mother Poverty |
| Brazilians | 92.4 /100 | #118 | Exceptional 28.3% |
| Immigrants | Syria | 92.4 /100 | #119 | Exceptional 28.3% |
| Cypriots | 92.3 /100 | #120 | Exceptional 28.3% |
| Immigrants | Afghanistan | 92.1 /100 | #121 | Exceptional 28.3% |
| Colombians | 91.8 /100 | #122 | Exceptional 28.3% |
| Uruguayans | 91.7 /100 | #123 | Exceptional 28.3% |
| Immigrants | Switzerland | 91.7 /100 | #124 | Exceptional 28.3% |
| Kenyans | 90.9 /100 | #125 | Exceptional 28.4% |
| Immigrants | Chile | 90.8 /100 | #126 | Exceptional 28.4% |
| Poles | 90.8 /100 | #127 | Exceptional 28.4% |
| Immigrants | England | 90.5 /100 | #128 | Exceptional 28.4% |
| South Americans | 90.4 /100 | #129 | Exceptional 28.4% |
| Norwegians | 90.4 /100 | #130 | Exceptional 28.4% |
| Immigrants | Austria | 90.3 /100 | #131 | Exceptional 28.4% |
| Immigrants | Morocco | 89.5 /100 | #132 | Excellent 28.4% |
| Swedes | 89.4 /100 | #133 | Excellent 28.4% |
| Immigrants | Southern Europe | 89.2 /100 | #134 | Excellent 28.4% |
| Immigrants | Spain | 89.2 /100 | #135 | Excellent 28.4% |
| Native Hawaiians | 88.9 /100 | #136 | Excellent 28.4% |
| Immigrants | Canada | 88.9 /100 | #137 | Excellent 28.4% |
| Immigrants | Belgium | 88.5 /100 | #138 | Excellent 28.5% |