Honduran vs Egyptian Single Mother Poverty
COMPARE
Honduran
Egyptian
Single Mother Poverty
Single Mother Poverty Comparison
Hondurans
Egyptians
34.2%
SINGLE MOTHER POVERTY
0.0/ 100
METRIC RATING
310th/ 347
METRIC RANK
26.9%
SINGLE MOTHER POVERTY
99.8/ 100
METRIC RATING
47th/ 347
METRIC RANK
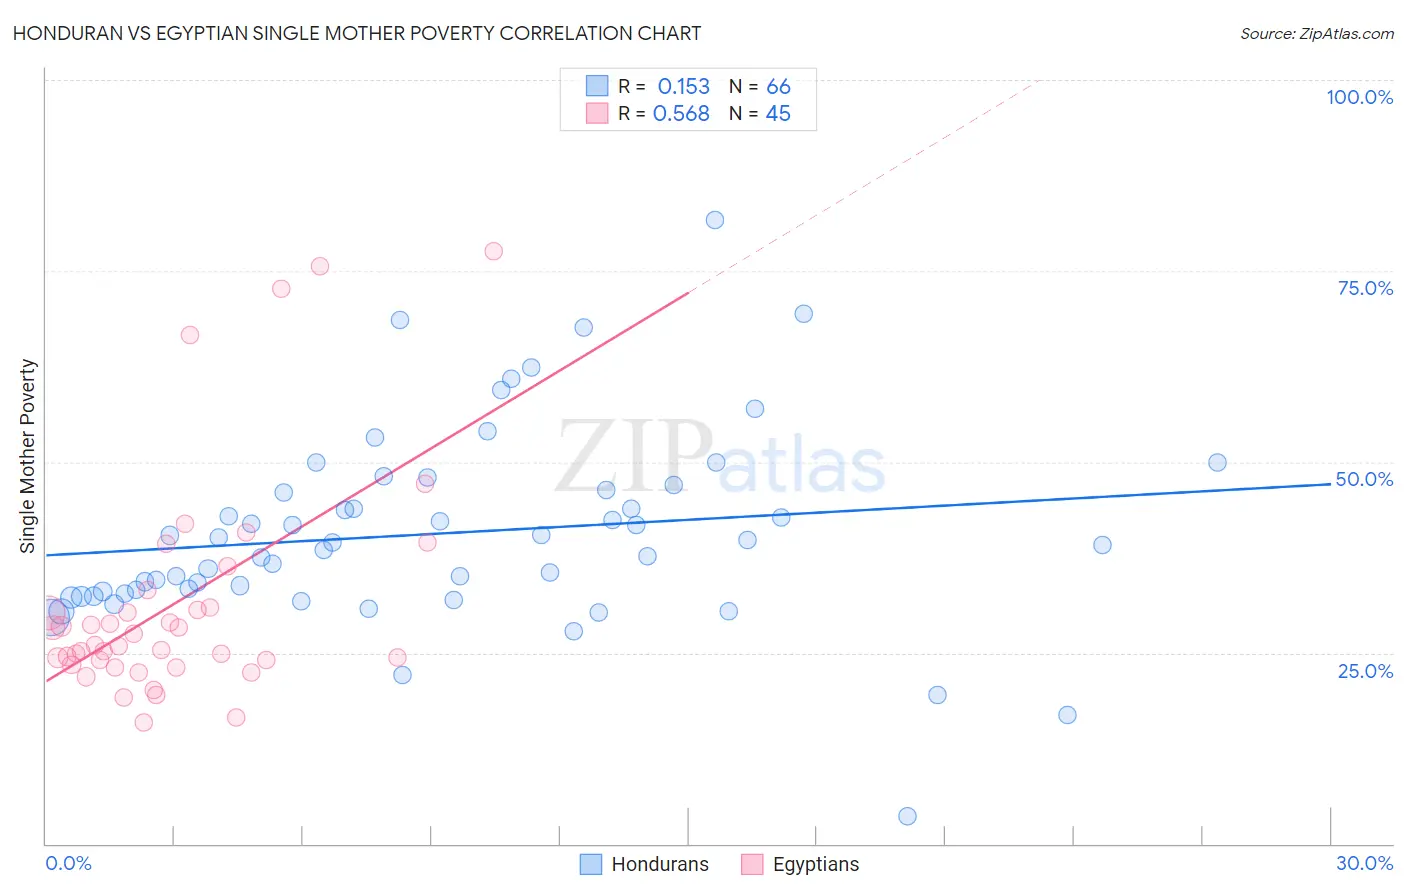
Honduran vs Egyptian Single Mother Poverty Correlation Chart
The statistical analysis conducted on geographies consisting of 352,983,929 people shows a poor positive correlation between the proportion of Hondurans and poverty level among single mothers in the United States with a correlation coefficient (R) of 0.153 and weighted average of 34.2%. Similarly, the statistical analysis conducted on geographies consisting of 271,623,906 people shows a substantial positive correlation between the proportion of Egyptians and poverty level among single mothers in the United States with a correlation coefficient (R) of 0.568 and weighted average of 26.9%, a difference of 27.1%.
Single Mother Poverty Correlation Summary
| Measurement | Honduran | Egyptian |
| Minimum | 3.6% | 15.9% |
| Maximum | 81.7% | 77.6% |
| Range | 78.2% | 61.7% |
| Mean | 40.6% | 31.5% |
| Median | 39.2% | 26.1% |
| Interquartile 25% (IQ1) | 32.8% | 23.8% |
| Interquartile 75% (IQ3) | 46.3% | 32.1% |
| Interquartile Range (IQR) | 13.5% | 8.3% |
| Standard Deviation (Sample) | 12.9% | 14.7% |
| Standard Deviation (Population) | 12.8% | 14.6% |
Similar Demographics by Single Mother Poverty
Demographics Similar to Hondurans by Single Mother Poverty
In terms of single mother poverty, the demographic groups most similar to Hondurans are Potawatomi (34.1%, a difference of 0.22%), Alsatian (34.3%, a difference of 0.31%), Central American Indian (34.3%, a difference of 0.39%), Immigrants from Dominican Republic (34.4%, a difference of 0.47%), and Immigrants from Mexico (34.0%, a difference of 0.64%).
| Demographics | Rating | Rank | Single Mother Poverty |
| Americans | 0.0 /100 | #303 | Tragic 33.5% |
| Mexicans | 0.0 /100 | #304 | Tragic 33.6% |
| Immigrants | Central America | 0.0 /100 | #305 | Tragic 33.6% |
| Immigrants | Congo | 0.0 /100 | #306 | Tragic 33.8% |
| Comanche | 0.0 /100 | #307 | Tragic 33.9% |
| Immigrants | Mexico | 0.0 /100 | #308 | Tragic 34.0% |
| Potawatomi | 0.0 /100 | #309 | Tragic 34.1% |
| Hondurans | 0.0 /100 | #310 | Tragic 34.2% |
| Alsatians | 0.0 /100 | #311 | Tragic 34.3% |
| Central American Indians | 0.0 /100 | #312 | Tragic 34.3% |
| Immigrants | Dominican Republic | 0.0 /100 | #313 | Tragic 34.4% |
| Chickasaw | 0.0 /100 | #314 | Tragic 34.4% |
| Hopi | 0.0 /100 | #315 | Tragic 34.5% |
| Dominicans | 0.0 /100 | #316 | Tragic 34.5% |
| Cherokee | 0.0 /100 | #317 | Tragic 34.5% |
Demographics Similar to Egyptians by Single Mother Poverty
In terms of single mother poverty, the demographic groups most similar to Egyptians are Immigrants from Serbia (26.9%, a difference of 0.060%), Immigrants from Poland (26.9%, a difference of 0.080%), Latvian (26.9%, a difference of 0.10%), Cambodian (27.0%, a difference of 0.16%), and Laotian (27.0%, a difference of 0.17%).
| Demographics | Rating | Rank | Single Mother Poverty |
| Immigrants | Vietnam | 99.9 /100 | #40 | Exceptional 26.7% |
| Immigrants | Greece | 99.9 /100 | #41 | Exceptional 26.7% |
| Armenians | 99.9 /100 | #42 | Exceptional 26.8% |
| Tsimshian | 99.9 /100 | #43 | Exceptional 26.8% |
| Immigrants | Sierra Leone | 99.9 /100 | #44 | Exceptional 26.9% |
| Latvians | 99.9 /100 | #45 | Exceptional 26.9% |
| Immigrants | Serbia | 99.9 /100 | #46 | Exceptional 26.9% |
| Egyptians | 99.8 /100 | #47 | Exceptional 26.9% |
| Immigrants | Poland | 99.8 /100 | #48 | Exceptional 26.9% |
| Cambodians | 99.8 /100 | #49 | Exceptional 27.0% |
| Laotians | 99.8 /100 | #50 | Exceptional 27.0% |
| Immigrants | Argentina | 99.7 /100 | #51 | Exceptional 27.1% |
| Immigrants | South Eastern Asia | 99.7 /100 | #52 | Exceptional 27.1% |
| Immigrants | Jordan | 99.7 /100 | #53 | Exceptional 27.1% |
| Immigrants | Bulgaria | 99.7 /100 | #54 | Exceptional 27.1% |