Honduran vs Immigrants from Netherlands Single Mother Poverty
COMPARE
Honduran
Immigrants from Netherlands
Single Mother Poverty
Single Mother Poverty Comparison
Hondurans
Immigrants from Netherlands
34.2%
SINGLE MOTHER POVERTY
0.0/ 100
METRIC RATING
310th/ 347
METRIC RANK
27.9%
SINGLE MOTHER POVERTY
97.2/ 100
METRIC RATING
99th/ 347
METRIC RANK
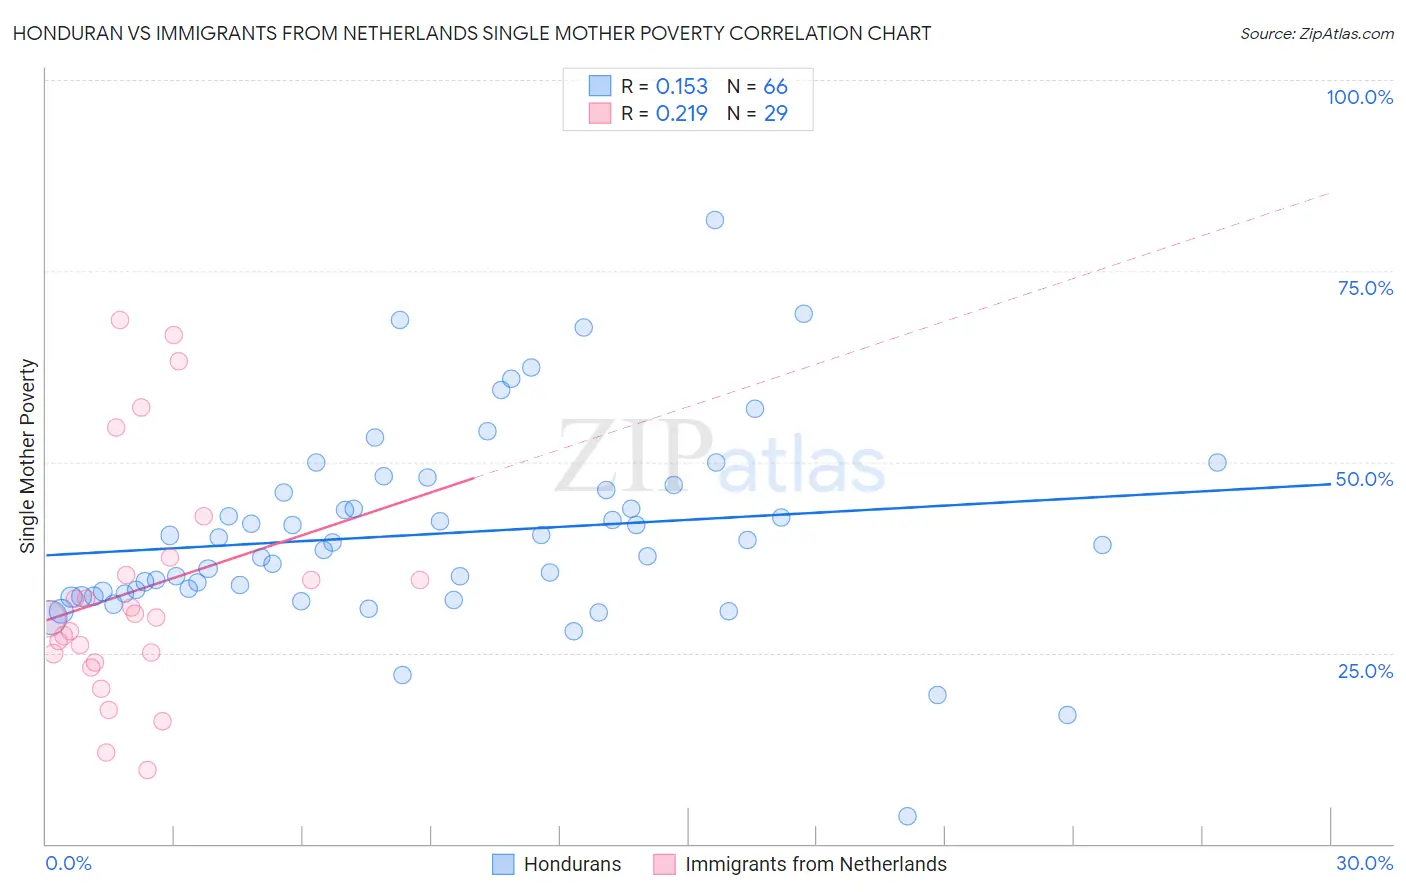
Honduran vs Immigrants from Netherlands Single Mother Poverty Correlation Chart
The statistical analysis conducted on geographies consisting of 352,983,929 people shows a poor positive correlation between the proportion of Hondurans and poverty level among single mothers in the United States with a correlation coefficient (R) of 0.153 and weighted average of 34.2%. Similarly, the statistical analysis conducted on geographies consisting of 233,130,258 people shows a weak positive correlation between the proportion of Immigrants from Netherlands and poverty level among single mothers in the United States with a correlation coefficient (R) of 0.219 and weighted average of 27.9%, a difference of 22.5%.
Single Mother Poverty Correlation Summary
| Measurement | Honduran | Immigrants from Netherlands |
| Minimum | 3.6% | 9.6% |
| Maximum | 81.7% | 68.6% |
| Range | 78.2% | 59.0% |
| Mean | 40.6% | 33.1% |
| Median | 39.2% | 29.6% |
| Interquartile 25% (IQ1) | 32.8% | 24.3% |
| Interquartile 75% (IQ3) | 46.3% | 36.4% |
| Interquartile Range (IQR) | 13.5% | 12.0% |
| Standard Deviation (Sample) | 12.9% | 15.4% |
| Standard Deviation (Population) | 12.8% | 15.1% |
Similar Demographics by Single Mother Poverty
Demographics Similar to Hondurans by Single Mother Poverty
In terms of single mother poverty, the demographic groups most similar to Hondurans are Potawatomi (34.1%, a difference of 0.22%), Alsatian (34.3%, a difference of 0.31%), Central American Indian (34.3%, a difference of 0.39%), Immigrants from Dominican Republic (34.4%, a difference of 0.47%), and Immigrants from Mexico (34.0%, a difference of 0.64%).
| Demographics | Rating | Rank | Single Mother Poverty |
| Americans | 0.0 /100 | #303 | Tragic 33.5% |
| Mexicans | 0.0 /100 | #304 | Tragic 33.6% |
| Immigrants | Central America | 0.0 /100 | #305 | Tragic 33.6% |
| Immigrants | Congo | 0.0 /100 | #306 | Tragic 33.8% |
| Comanche | 0.0 /100 | #307 | Tragic 33.9% |
| Immigrants | Mexico | 0.0 /100 | #308 | Tragic 34.0% |
| Potawatomi | 0.0 /100 | #309 | Tragic 34.1% |
| Hondurans | 0.0 /100 | #310 | Tragic 34.2% |
| Alsatians | 0.0 /100 | #311 | Tragic 34.3% |
| Central American Indians | 0.0 /100 | #312 | Tragic 34.3% |
| Immigrants | Dominican Republic | 0.0 /100 | #313 | Tragic 34.4% |
| Chickasaw | 0.0 /100 | #314 | Tragic 34.4% |
| Hopi | 0.0 /100 | #315 | Tragic 34.5% |
| Dominicans | 0.0 /100 | #316 | Tragic 34.5% |
| Cherokee | 0.0 /100 | #317 | Tragic 34.5% |
Demographics Similar to Immigrants from Netherlands by Single Mother Poverty
In terms of single mother poverty, the demographic groups most similar to Immigrants from Netherlands are Immigrants from Nepal (27.9%, a difference of 0.010%), Immigrants from Brazil (27.9%, a difference of 0.020%), Zimbabwean (27.9%, a difference of 0.050%), Immigrants from Iraq (27.9%, a difference of 0.060%), and Pakistani (28.0%, a difference of 0.11%).
| Demographics | Rating | Rank | Single Mother Poverty |
| Estonians | 97.9 /100 | #92 | Exceptional 27.8% |
| Romanians | 97.8 /100 | #93 | Exceptional 27.8% |
| Albanians | 97.6 /100 | #94 | Exceptional 27.9% |
| Chileans | 97.5 /100 | #95 | Exceptional 27.9% |
| Immigrants | Iraq | 97.3 /100 | #96 | Exceptional 27.9% |
| Immigrants | Brazil | 97.2 /100 | #97 | Exceptional 27.9% |
| Immigrants | Nepal | 97.2 /100 | #98 | Exceptional 27.9% |
| Immigrants | Netherlands | 97.2 /100 | #99 | Exceptional 27.9% |
| Zimbabweans | 97.1 /100 | #100 | Exceptional 27.9% |
| Pakistanis | 96.9 /100 | #101 | Exceptional 28.0% |
| Immigrants | Croatia | 96.7 /100 | #102 | Exceptional 28.0% |
| Immigrants | Northern Africa | 96.6 /100 | #103 | Exceptional 28.0% |
| Italians | 96.6 /100 | #104 | Exceptional 28.0% |
| Israelis | 96.5 /100 | #105 | Exceptional 28.0% |
| Ukrainians | 96.4 /100 | #106 | Exceptional 28.0% |