Honduran vs Immigrants from Eritrea Single Mother Poverty
COMPARE
Honduran
Immigrants from Eritrea
Single Mother Poverty
Single Mother Poverty Comparison
Hondurans
Immigrants from Eritrea
34.2%
SINGLE MOTHER POVERTY
0.0/ 100
METRIC RATING
310th/ 347
METRIC RANK
30.0%
SINGLE MOTHER POVERTY
7.7/ 100
METRIC RATING
221st/ 347
METRIC RANK
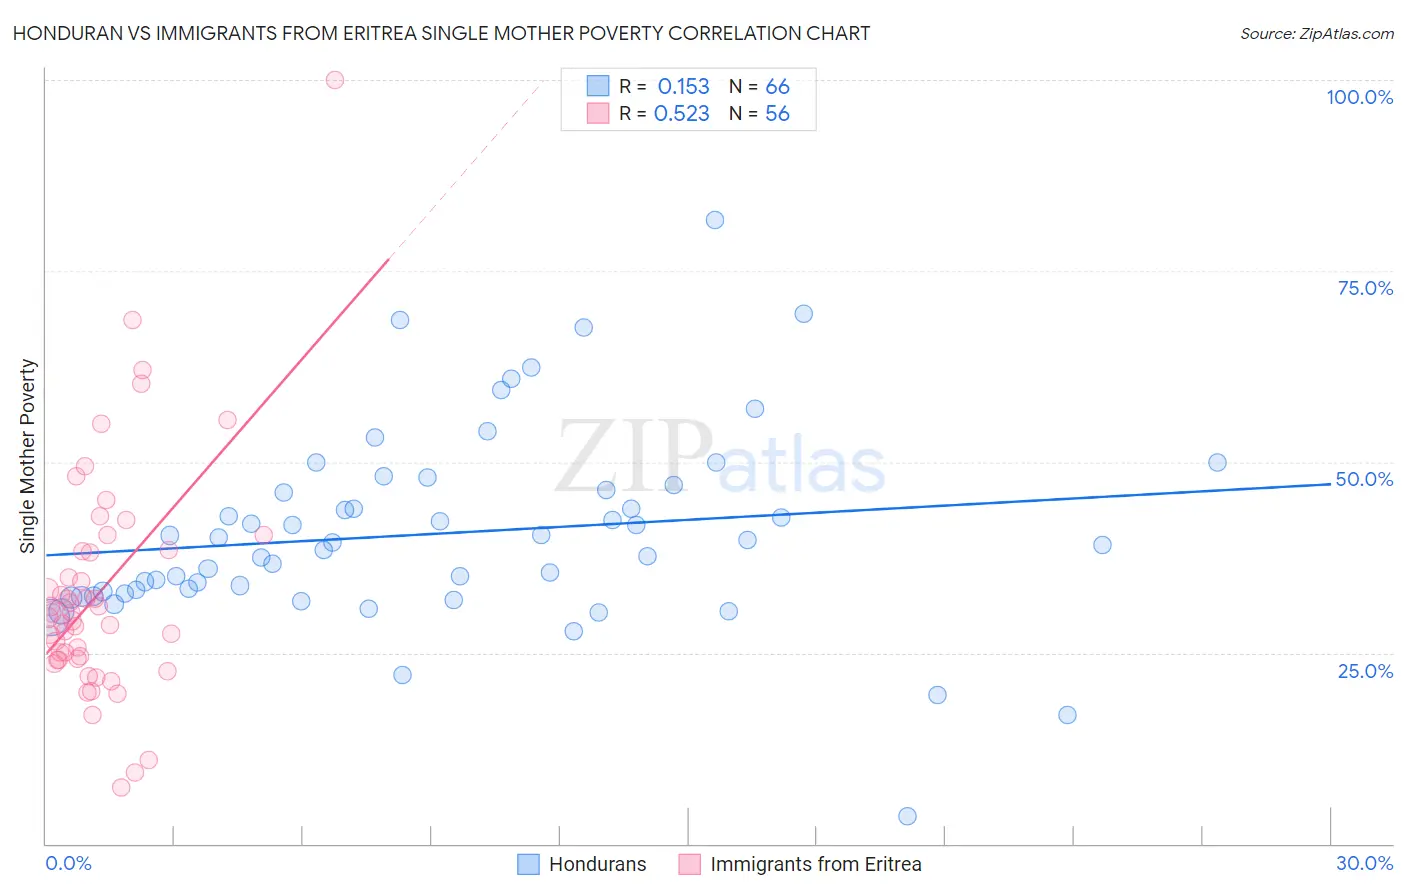
Honduran vs Immigrants from Eritrea Single Mother Poverty Correlation Chart
The statistical analysis conducted on geographies consisting of 352,983,929 people shows a poor positive correlation between the proportion of Hondurans and poverty level among single mothers in the United States with a correlation coefficient (R) of 0.153 and weighted average of 34.2%. Similarly, the statistical analysis conducted on geographies consisting of 104,521,443 people shows a substantial positive correlation between the proportion of Immigrants from Eritrea and poverty level among single mothers in the United States with a correlation coefficient (R) of 0.523 and weighted average of 30.0%, a difference of 13.9%.
Single Mother Poverty Correlation Summary
| Measurement | Honduran | Immigrants from Eritrea |
| Minimum | 3.6% | 7.4% |
| Maximum | 81.7% | 100.0% |
| Range | 78.2% | 92.6% |
| Mean | 40.6% | 33.1% |
| Median | 39.2% | 29.9% |
| Interquartile 25% (IQ1) | 32.8% | 24.1% |
| Interquartile 75% (IQ3) | 46.3% | 38.4% |
| Interquartile Range (IQR) | 13.5% | 14.2% |
| Standard Deviation (Sample) | 12.9% | 15.5% |
| Standard Deviation (Population) | 12.8% | 15.3% |
Similar Demographics by Single Mother Poverty
Demographics Similar to Hondurans by Single Mother Poverty
In terms of single mother poverty, the demographic groups most similar to Hondurans are Potawatomi (34.1%, a difference of 0.22%), Alsatian (34.3%, a difference of 0.31%), Central American Indian (34.3%, a difference of 0.39%), Immigrants from Dominican Republic (34.4%, a difference of 0.47%), and Immigrants from Mexico (34.0%, a difference of 0.64%).
| Demographics | Rating | Rank | Single Mother Poverty |
| Americans | 0.0 /100 | #303 | Tragic 33.5% |
| Mexicans | 0.0 /100 | #304 | Tragic 33.6% |
| Immigrants | Central America | 0.0 /100 | #305 | Tragic 33.6% |
| Immigrants | Congo | 0.0 /100 | #306 | Tragic 33.8% |
| Comanche | 0.0 /100 | #307 | Tragic 33.9% |
| Immigrants | Mexico | 0.0 /100 | #308 | Tragic 34.0% |
| Potawatomi | 0.0 /100 | #309 | Tragic 34.1% |
| Hondurans | 0.0 /100 | #310 | Tragic 34.2% |
| Alsatians | 0.0 /100 | #311 | Tragic 34.3% |
| Central American Indians | 0.0 /100 | #312 | Tragic 34.3% |
| Immigrants | Dominican Republic | 0.0 /100 | #313 | Tragic 34.4% |
| Chickasaw | 0.0 /100 | #314 | Tragic 34.4% |
| Hopi | 0.0 /100 | #315 | Tragic 34.5% |
| Dominicans | 0.0 /100 | #316 | Tragic 34.5% |
| Cherokee | 0.0 /100 | #317 | Tragic 34.5% |
Demographics Similar to Immigrants from Eritrea by Single Mother Poverty
In terms of single mother poverty, the demographic groups most similar to Immigrants from Eritrea are Sudanese (30.0%, a difference of 0.010%), Immigrants from Cuba (30.1%, a difference of 0.14%), German (30.0%, a difference of 0.17%), Immigrants from Sudan (30.1%, a difference of 0.21%), and Spanish (30.1%, a difference of 0.23%).
| Demographics | Rating | Rank | Single Mother Poverty |
| Liberians | 11.7 /100 | #214 | Poor 29.9% |
| Jamaicans | 11.7 /100 | #215 | Poor 29.9% |
| Immigrants | Western Africa | 11.5 /100 | #216 | Poor 29.9% |
| Immigrants | Ghana | 11.3 /100 | #217 | Poor 29.9% |
| Hungarians | 10.3 /100 | #218 | Poor 29.9% |
| Finns | 9.3 /100 | #219 | Tragic 30.0% |
| Germans | 8.8 /100 | #220 | Tragic 30.0% |
| Immigrants | Eritrea | 7.7 /100 | #221 | Tragic 30.0% |
| Sudanese | 7.6 /100 | #222 | Tragic 30.0% |
| Immigrants | Cuba | 6.9 /100 | #223 | Tragic 30.1% |
| Immigrants | Sudan | 6.5 /100 | #224 | Tragic 30.1% |
| Spanish | 6.3 /100 | #225 | Tragic 30.1% |
| Scottish | 6.0 /100 | #226 | Tragic 30.1% |
| Immigrants | Liberia | 5.9 /100 | #227 | Tragic 30.1% |
| Spaniards | 5.4 /100 | #228 | Tragic 30.2% |