Honduran vs Alaskan Athabascan Single Mother Poverty
COMPARE
Honduran
Alaskan Athabascan
Single Mother Poverty
Single Mother Poverty Comparison
Hondurans
Alaskan Athabascans
34.2%
SINGLE MOTHER POVERTY
0.0/ 100
METRIC RATING
310th/ 347
METRIC RANK
30.3%
SINGLE MOTHER POVERTY
4.1/ 100
METRIC RATING
232nd/ 347
METRIC RANK
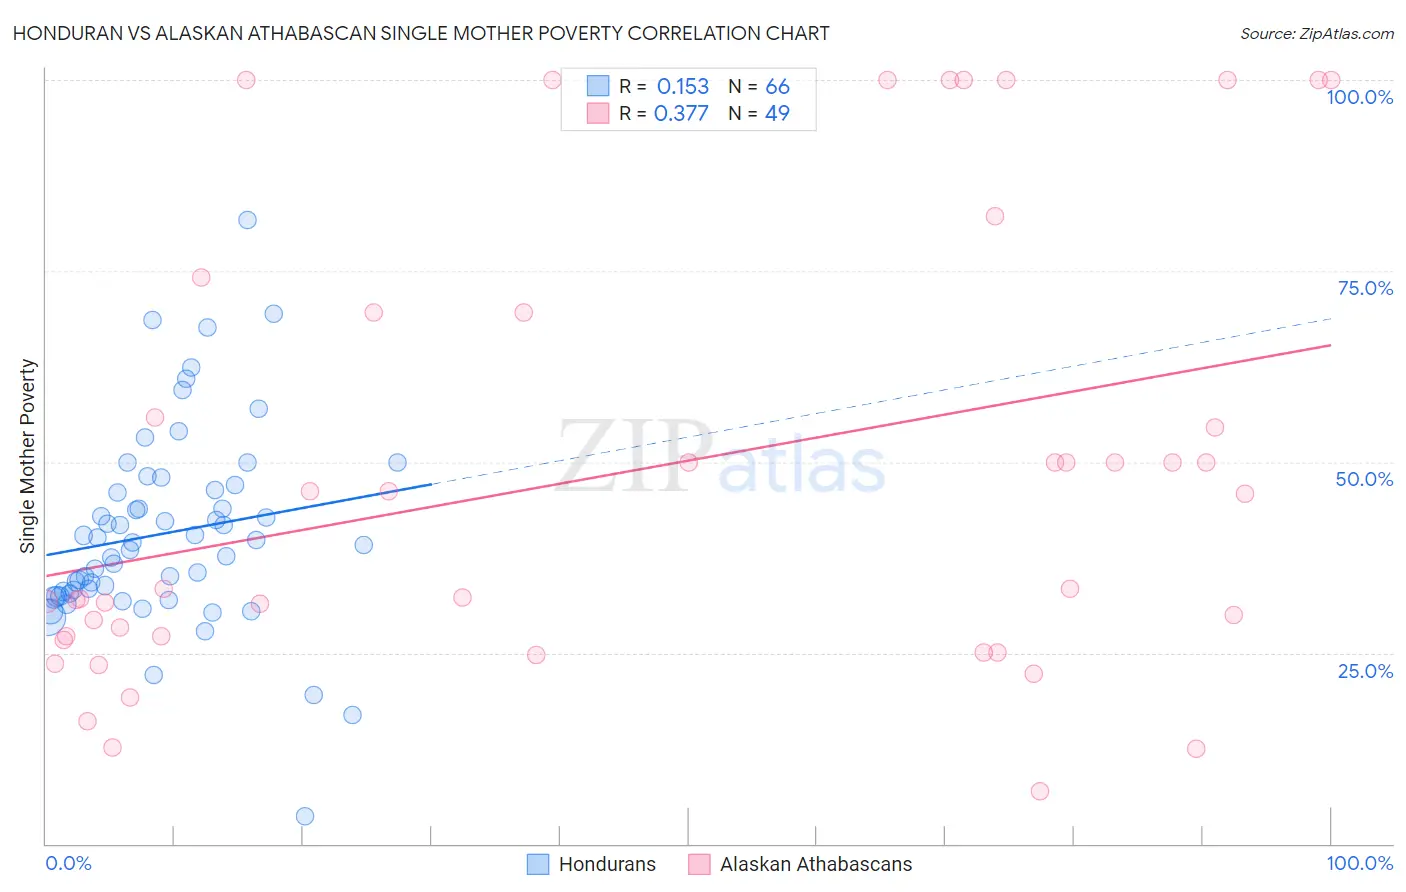
Honduran vs Alaskan Athabascan Single Mother Poverty Correlation Chart
The statistical analysis conducted on geographies consisting of 352,983,929 people shows a poor positive correlation between the proportion of Hondurans and poverty level among single mothers in the United States with a correlation coefficient (R) of 0.153 and weighted average of 34.2%. Similarly, the statistical analysis conducted on geographies consisting of 45,529,547 people shows a mild positive correlation between the proportion of Alaskan Athabascans and poverty level among single mothers in the United States with a correlation coefficient (R) of 0.377 and weighted average of 30.3%, a difference of 13.0%.
Single Mother Poverty Correlation Summary
| Measurement | Honduran | Alaskan Athabascan |
| Minimum | 3.6% | 6.8% |
| Maximum | 81.7% | 100.0% |
| Range | 78.2% | 93.2% |
| Mean | 40.6% | 48.6% |
| Median | 39.2% | 33.3% |
| Interquartile 25% (IQ1) | 32.8% | 26.9% |
| Interquartile 75% (IQ3) | 46.3% | 69.6% |
| Interquartile Range (IQR) | 13.5% | 42.6% |
| Standard Deviation (Sample) | 12.9% | 29.3% |
| Standard Deviation (Population) | 12.8% | 29.0% |
Similar Demographics by Single Mother Poverty
Demographics Similar to Hondurans by Single Mother Poverty
In terms of single mother poverty, the demographic groups most similar to Hondurans are Potawatomi (34.1%, a difference of 0.22%), Alsatian (34.3%, a difference of 0.31%), Central American Indian (34.3%, a difference of 0.39%), Immigrants from Dominican Republic (34.4%, a difference of 0.47%), and Immigrants from Mexico (34.0%, a difference of 0.64%).
| Demographics | Rating | Rank | Single Mother Poverty |
| Americans | 0.0 /100 | #303 | Tragic 33.5% |
| Mexicans | 0.0 /100 | #304 | Tragic 33.6% |
| Immigrants | Central America | 0.0 /100 | #305 | Tragic 33.6% |
| Immigrants | Congo | 0.0 /100 | #306 | Tragic 33.8% |
| Comanche | 0.0 /100 | #307 | Tragic 33.9% |
| Immigrants | Mexico | 0.0 /100 | #308 | Tragic 34.0% |
| Potawatomi | 0.0 /100 | #309 | Tragic 34.1% |
| Hondurans | 0.0 /100 | #310 | Tragic 34.2% |
| Alsatians | 0.0 /100 | #311 | Tragic 34.3% |
| Central American Indians | 0.0 /100 | #312 | Tragic 34.3% |
| Immigrants | Dominican Republic | 0.0 /100 | #313 | Tragic 34.4% |
| Chickasaw | 0.0 /100 | #314 | Tragic 34.4% |
| Hopi | 0.0 /100 | #315 | Tragic 34.5% |
| Dominicans | 0.0 /100 | #316 | Tragic 34.5% |
| Cherokee | 0.0 /100 | #317 | Tragic 34.5% |
Demographics Similar to Alaskan Athabascans by Single Mother Poverty
In terms of single mother poverty, the demographic groups most similar to Alaskan Athabascans are Dutch (30.2%, a difference of 0.040%), English (30.2%, a difference of 0.19%), Immigrants from Middle Africa (30.3%, a difference of 0.21%), Immigrants from Nicaragua (30.3%, a difference of 0.22%), and Immigrants from Barbados (30.2%, a difference of 0.23%).
| Demographics | Rating | Rank | Single Mother Poverty |
| Spanish | 6.3 /100 | #225 | Tragic 30.1% |
| Scottish | 6.0 /100 | #226 | Tragic 30.1% |
| Immigrants | Liberia | 5.9 /100 | #227 | Tragic 30.1% |
| Spaniards | 5.4 /100 | #228 | Tragic 30.2% |
| Immigrants | Barbados | 5.0 /100 | #229 | Tragic 30.2% |
| English | 4.8 /100 | #230 | Tragic 30.2% |
| Dutch | 4.3 /100 | #231 | Tragic 30.2% |
| Alaskan Athabascans | 4.1 /100 | #232 | Tragic 30.3% |
| Immigrants | Middle Africa | 3.5 /100 | #233 | Tragic 30.3% |
| Immigrants | Nicaragua | 3.5 /100 | #234 | Tragic 30.3% |
| Immigrants | Grenada | 3.4 /100 | #235 | Tragic 30.3% |
| Welsh | 3.2 /100 | #236 | Tragic 30.4% |
| Immigrants | St. Vincent and the Grenadines | 3.1 /100 | #237 | Tragic 30.4% |
| Slovaks | 2.8 /100 | #238 | Tragic 30.4% |
| Immigrants | Portugal | 2.1 /100 | #239 | Tragic 30.5% |