Serbian vs Immigrants from Netherlands Single Mother Poverty
COMPARE
Serbian
Immigrants from Netherlands
Single Mother Poverty
Single Mother Poverty Comparison
Serbians
Immigrants from Netherlands
28.6%
SINGLE MOTHER POVERTY
85.0/ 100
METRIC RATING
149th/ 347
METRIC RANK
27.9%
SINGLE MOTHER POVERTY
97.2/ 100
METRIC RATING
99th/ 347
METRIC RANK
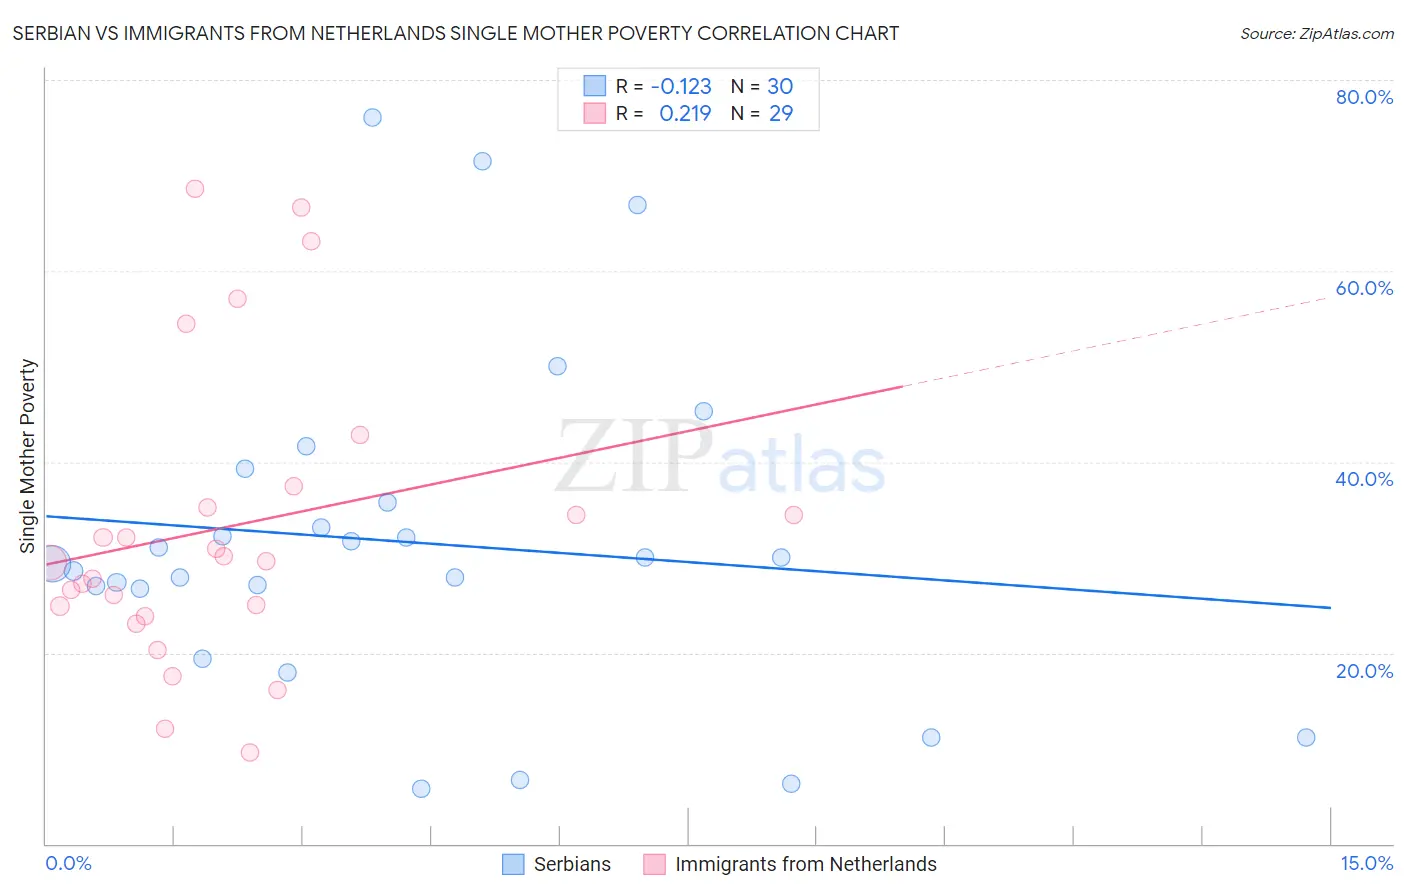
Serbian vs Immigrants from Netherlands Single Mother Poverty Correlation Chart
The statistical analysis conducted on geographies consisting of 262,198,183 people shows a poor negative correlation between the proportion of Serbians and poverty level among single mothers in the United States with a correlation coefficient (R) of -0.123 and weighted average of 28.6%. Similarly, the statistical analysis conducted on geographies consisting of 233,130,258 people shows a weak positive correlation between the proportion of Immigrants from Netherlands and poverty level among single mothers in the United States with a correlation coefficient (R) of 0.219 and weighted average of 27.9%, a difference of 2.3%.
Single Mother Poverty Correlation Summary
| Measurement | Serbian | Immigrants from Netherlands |
| Minimum | 5.8% | 9.6% |
| Maximum | 76.1% | 68.6% |
| Range | 70.4% | 59.0% |
| Mean | 31.6% | 33.1% |
| Median | 29.6% | 29.6% |
| Interquartile 25% (IQ1) | 26.8% | 24.3% |
| Interquartile 75% (IQ3) | 35.8% | 36.4% |
| Interquartile Range (IQR) | 9.0% | 12.0% |
| Standard Deviation (Sample) | 17.4% | 15.4% |
| Standard Deviation (Population) | 17.1% | 15.1% |
Similar Demographics by Single Mother Poverty
Demographics Similar to Serbians by Single Mother Poverty
In terms of single mother poverty, the demographic groups most similar to Serbians are Syrian (28.6%, a difference of 0.020%), Immigrants from Lebanon (28.6%, a difference of 0.030%), Immigrants from Denmark (28.5%, a difference of 0.10%), Immigrants from South America (28.5%, a difference of 0.11%), and Luxembourger (28.5%, a difference of 0.14%).
| Demographics | Rating | Rank | Single Mother Poverty |
| South Africans | 86.6 /100 | #142 | Excellent 28.5% |
| Immigrants | North America | 86.5 /100 | #143 | Excellent 28.5% |
| Luxembourgers | 86.4 /100 | #144 | Excellent 28.5% |
| Immigrants | South America | 86.1 /100 | #145 | Excellent 28.5% |
| Immigrants | Denmark | 86.1 /100 | #146 | Excellent 28.5% |
| Immigrants | Lebanon | 85.3 /100 | #147 | Excellent 28.6% |
| Syrians | 85.3 /100 | #148 | Excellent 28.6% |
| Serbians | 85.0 /100 | #149 | Excellent 28.6% |
| Northern Europeans | 81.7 /100 | #150 | Excellent 28.6% |
| Immigrants | Oceania | 79.9 /100 | #151 | Good 28.7% |
| Austrians | 79.0 /100 | #152 | Good 28.7% |
| Slovenes | 76.4 /100 | #153 | Good 28.8% |
| Portuguese | 73.2 /100 | #154 | Good 28.8% |
| Ugandans | 71.7 /100 | #155 | Good 28.8% |
| Iraqis | 71.5 /100 | #156 | Good 28.8% |
Demographics Similar to Immigrants from Netherlands by Single Mother Poverty
In terms of single mother poverty, the demographic groups most similar to Immigrants from Netherlands are Immigrants from Nepal (27.9%, a difference of 0.010%), Immigrants from Brazil (27.9%, a difference of 0.020%), Zimbabwean (27.9%, a difference of 0.050%), Immigrants from Iraq (27.9%, a difference of 0.060%), and Pakistani (28.0%, a difference of 0.11%).
| Demographics | Rating | Rank | Single Mother Poverty |
| Estonians | 97.9 /100 | #92 | Exceptional 27.8% |
| Romanians | 97.8 /100 | #93 | Exceptional 27.8% |
| Albanians | 97.6 /100 | #94 | Exceptional 27.9% |
| Chileans | 97.5 /100 | #95 | Exceptional 27.9% |
| Immigrants | Iraq | 97.3 /100 | #96 | Exceptional 27.9% |
| Immigrants | Brazil | 97.2 /100 | #97 | Exceptional 27.9% |
| Immigrants | Nepal | 97.2 /100 | #98 | Exceptional 27.9% |
| Immigrants | Netherlands | 97.2 /100 | #99 | Exceptional 27.9% |
| Zimbabweans | 97.1 /100 | #100 | Exceptional 27.9% |
| Pakistanis | 96.9 /100 | #101 | Exceptional 28.0% |
| Immigrants | Croatia | 96.7 /100 | #102 | Exceptional 28.0% |
| Immigrants | Northern Africa | 96.6 /100 | #103 | Exceptional 28.0% |
| Italians | 96.6 /100 | #104 | Exceptional 28.0% |
| Israelis | 96.5 /100 | #105 | Exceptional 28.0% |
| Ukrainians | 96.4 /100 | #106 | Exceptional 28.0% |