Iraqi vs Immigrants from Netherlands Single Mother Poverty
COMPARE
Iraqi
Immigrants from Netherlands
Single Mother Poverty
Single Mother Poverty Comparison
Iraqis
Immigrants from Netherlands
28.8%
SINGLE MOTHER POVERTY
71.5/ 100
METRIC RATING
156th/ 347
METRIC RANK
27.9%
SINGLE MOTHER POVERTY
97.2/ 100
METRIC RATING
99th/ 347
METRIC RANK
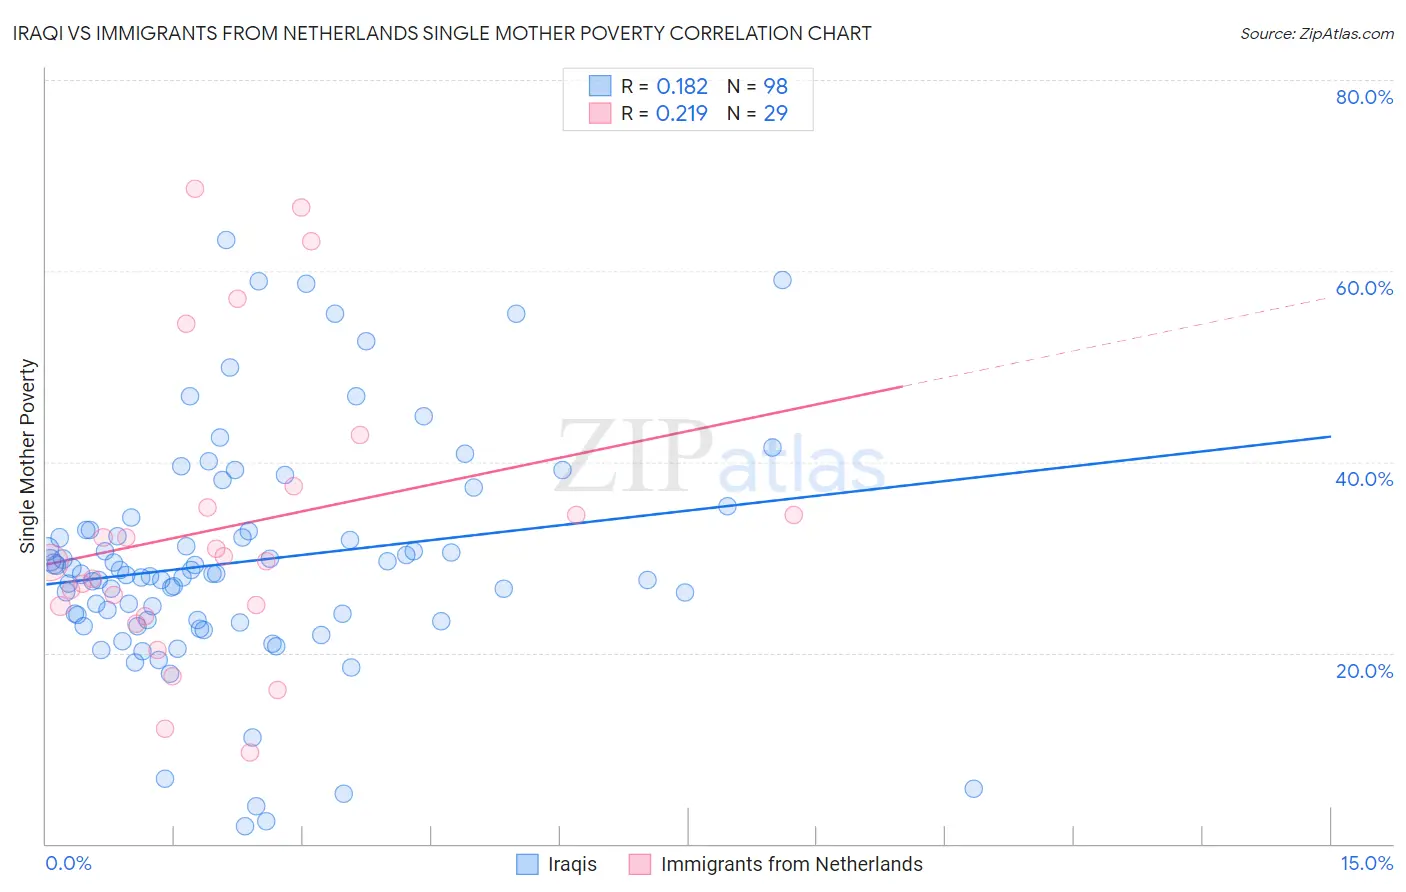
Iraqi vs Immigrants from Netherlands Single Mother Poverty Correlation Chart
The statistical analysis conducted on geographies consisting of 169,065,579 people shows a poor positive correlation between the proportion of Iraqis and poverty level among single mothers in the United States with a correlation coefficient (R) of 0.182 and weighted average of 28.8%. Similarly, the statistical analysis conducted on geographies consisting of 233,130,258 people shows a weak positive correlation between the proportion of Immigrants from Netherlands and poverty level among single mothers in the United States with a correlation coefficient (R) of 0.219 and weighted average of 27.9%, a difference of 3.3%.
Single Mother Poverty Correlation Summary
| Measurement | Iraqi | Immigrants from Netherlands |
| Minimum | 1.9% | 9.6% |
| Maximum | 63.2% | 68.6% |
| Range | 61.3% | 59.0% |
| Mean | 29.6% | 33.1% |
| Median | 28.2% | 29.6% |
| Interquartile 25% (IQ1) | 23.4% | 24.3% |
| Interquartile 75% (IQ3) | 32.9% | 36.4% |
| Interquartile Range (IQR) | 9.4% | 12.0% |
| Standard Deviation (Sample) | 11.9% | 15.4% |
| Standard Deviation (Population) | 11.9% | 15.1% |
Similar Demographics by Single Mother Poverty
Demographics Similar to Iraqis by Single Mother Poverty
In terms of single mother poverty, the demographic groups most similar to Iraqis are Ugandan (28.8%, a difference of 0.010%), Immigrants from Western Europe (28.9%, a difference of 0.030%), Immigrants from Hungary (28.9%, a difference of 0.060%), Portuguese (28.8%, a difference of 0.10%), and Czech (28.9%, a difference of 0.18%).
| Demographics | Rating | Rank | Single Mother Poverty |
| Serbians | 85.0 /100 | #149 | Excellent 28.6% |
| Northern Europeans | 81.7 /100 | #150 | Excellent 28.6% |
| Immigrants | Oceania | 79.9 /100 | #151 | Good 28.7% |
| Austrians | 79.0 /100 | #152 | Good 28.7% |
| Slovenes | 76.4 /100 | #153 | Good 28.8% |
| Portuguese | 73.2 /100 | #154 | Good 28.8% |
| Ugandans | 71.7 /100 | #155 | Good 28.8% |
| Iraqis | 71.5 /100 | #156 | Good 28.8% |
| Immigrants | Western Europe | 71.1 /100 | #157 | Good 28.9% |
| Immigrants | Hungary | 70.6 /100 | #158 | Good 28.9% |
| Czechs | 68.4 /100 | #159 | Good 28.9% |
| Japanese | 68.0 /100 | #160 | Good 28.9% |
| Immigrants | Cambodia | 66.6 /100 | #161 | Good 28.9% |
| Scandinavians | 66.2 /100 | #162 | Good 28.9% |
| Immigrants | Nigeria | 65.9 /100 | #163 | Good 28.9% |
Demographics Similar to Immigrants from Netherlands by Single Mother Poverty
In terms of single mother poverty, the demographic groups most similar to Immigrants from Netherlands are Immigrants from Nepal (27.9%, a difference of 0.010%), Immigrants from Brazil (27.9%, a difference of 0.020%), Zimbabwean (27.9%, a difference of 0.050%), Immigrants from Iraq (27.9%, a difference of 0.060%), and Pakistani (28.0%, a difference of 0.11%).
| Demographics | Rating | Rank | Single Mother Poverty |
| Estonians | 97.9 /100 | #92 | Exceptional 27.8% |
| Romanians | 97.8 /100 | #93 | Exceptional 27.8% |
| Albanians | 97.6 /100 | #94 | Exceptional 27.9% |
| Chileans | 97.5 /100 | #95 | Exceptional 27.9% |
| Immigrants | Iraq | 97.3 /100 | #96 | Exceptional 27.9% |
| Immigrants | Brazil | 97.2 /100 | #97 | Exceptional 27.9% |
| Immigrants | Nepal | 97.2 /100 | #98 | Exceptional 27.9% |
| Immigrants | Netherlands | 97.2 /100 | #99 | Exceptional 27.9% |
| Zimbabweans | 97.1 /100 | #100 | Exceptional 27.9% |
| Pakistanis | 96.9 /100 | #101 | Exceptional 28.0% |
| Immigrants | Croatia | 96.7 /100 | #102 | Exceptional 28.0% |
| Immigrants | Northern Africa | 96.6 /100 | #103 | Exceptional 28.0% |
| Italians | 96.6 /100 | #104 | Exceptional 28.0% |
| Israelis | 96.5 /100 | #105 | Exceptional 28.0% |
| Ukrainians | 96.4 /100 | #106 | Exceptional 28.0% |