Honduran vs Immigrants from Eritrea 4th Grade
COMPARE
Honduran
Immigrants from Eritrea
4th Grade
4th Grade Comparison
Hondurans
Immigrants from Eritrea
96.0%
4TH GRADE
0.0/ 100
METRIC RATING
327th/ 347
METRIC RANK
96.7%
4TH GRADE
0.0/ 100
METRIC RATING
294th/ 347
METRIC RANK
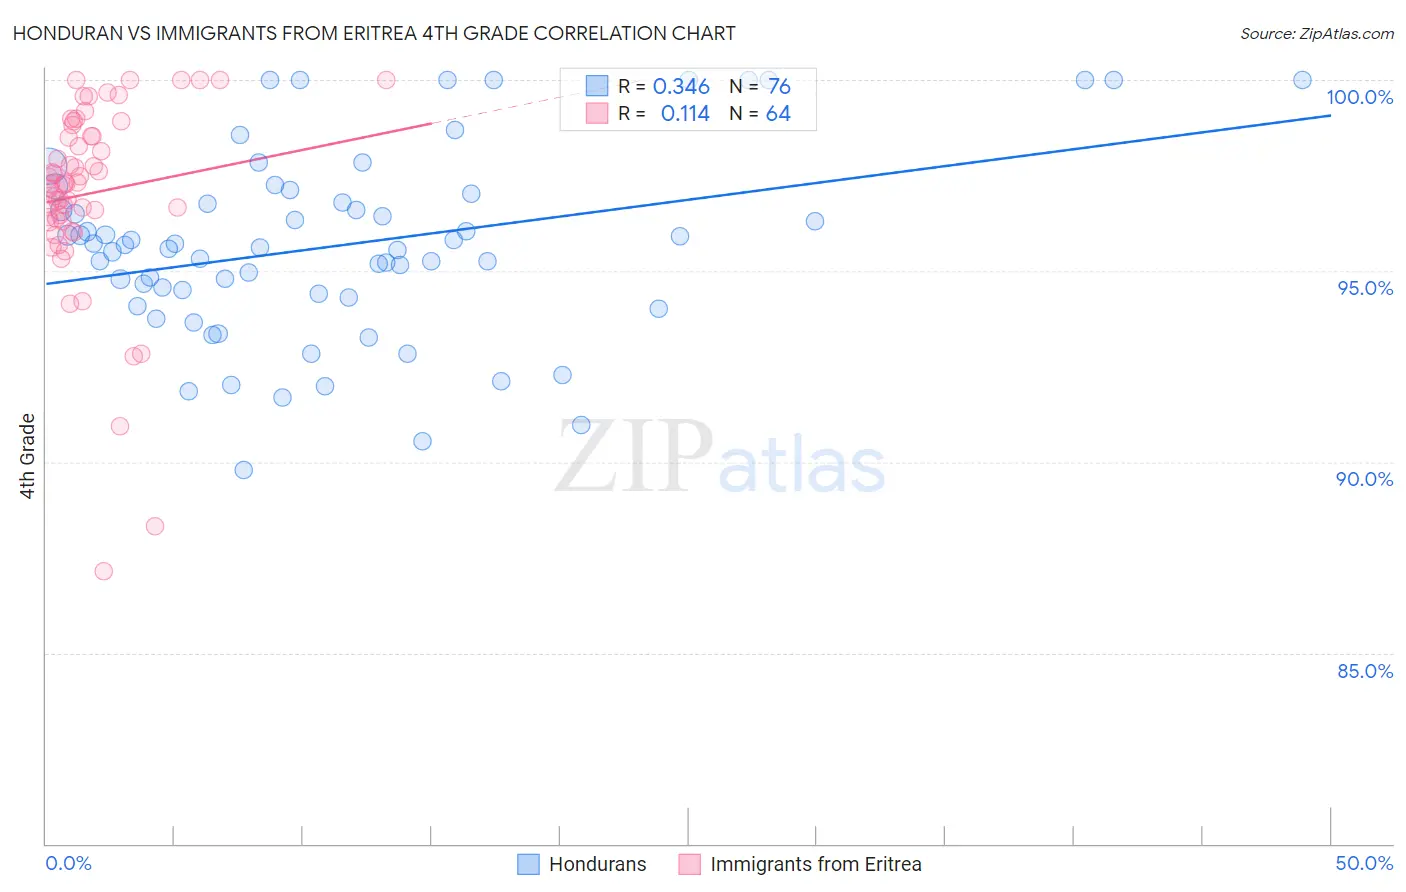
Honduran vs Immigrants from Eritrea 4th Grade Correlation Chart
The statistical analysis conducted on geographies consisting of 357,784,803 people shows a mild positive correlation between the proportion of Hondurans and percentage of population with at least 4th grade education in the United States with a correlation coefficient (R) of 0.346 and weighted average of 96.0%. Similarly, the statistical analysis conducted on geographies consisting of 104,791,429 people shows a poor positive correlation between the proportion of Immigrants from Eritrea and percentage of population with at least 4th grade education in the United States with a correlation coefficient (R) of 0.114 and weighted average of 96.7%, a difference of 0.73%.
4th Grade Correlation Summary
| Measurement | Honduran | Immigrants from Eritrea |
| Minimum | 89.8% | 87.1% |
| Maximum | 100.0% | 100.0% |
| Range | 10.2% | 12.9% |
| Mean | 95.7% | 97.0% |
| Median | 95.7% | 97.3% |
| Interquartile 25% (IQ1) | 94.4% | 96.3% |
| Interquartile 75% (IQ3) | 96.9% | 98.7% |
| Interquartile Range (IQR) | 2.6% | 2.3% |
| Standard Deviation (Sample) | 2.5% | 2.5% |
| Standard Deviation (Population) | 2.4% | 2.5% |
Similar Demographics by 4th Grade
Demographics Similar to Hondurans by 4th Grade
In terms of 4th grade, the demographic groups most similar to Hondurans are Dominican (96.0%, a difference of 0.020%), Hispanic or Latino (96.0%, a difference of 0.020%), Immigrants from Belize (96.0%, a difference of 0.030%), Immigrants from Nicaragua (96.0%, a difference of 0.040%), and Japanese (96.0%, a difference of 0.060%).
| Demographics | Rating | Rank | 4th Grade |
| Bangladeshis | 0.0 /100 | #320 | Tragic 96.1% |
| Japanese | 0.0 /100 | #321 | Tragic 96.0% |
| Immigrants | Vietnam | 0.0 /100 | #322 | Tragic 96.0% |
| Immigrants | Nicaragua | 0.0 /100 | #323 | Tragic 96.0% |
| Immigrants | Belize | 0.0 /100 | #324 | Tragic 96.0% |
| Dominicans | 0.0 /100 | #325 | Tragic 96.0% |
| Hispanics or Latinos | 0.0 /100 | #326 | Tragic 96.0% |
| Hondurans | 0.0 /100 | #327 | Tragic 96.0% |
| Mexican American Indians | 0.0 /100 | #328 | Tragic 95.8% |
| Immigrants | Cambodia | 0.0 /100 | #329 | Tragic 95.8% |
| Immigrants | Fiji | 0.0 /100 | #330 | Tragic 95.8% |
| Immigrants | Armenia | 0.0 /100 | #331 | Tragic 95.8% |
| Immigrants | Honduras | 0.0 /100 | #332 | Tragic 95.8% |
| Immigrants | Dominican Republic | 0.0 /100 | #333 | Tragic 95.7% |
| Immigrants | Cabo Verde | 0.0 /100 | #334 | Tragic 95.7% |
Demographics Similar to Immigrants from Eritrea by 4th Grade
In terms of 4th grade, the demographic groups most similar to Immigrants from Eritrea are Puerto Rican (96.7%, a difference of 0.020%), Immigrants from Portugal (96.6%, a difference of 0.020%), Somali (96.6%, a difference of 0.030%), Malaysian (96.7%, a difference of 0.040%), and Immigrants from Grenada (96.7%, a difference of 0.050%).
| Demographics | Rating | Rank | 4th Grade |
| Houma | 0.0 /100 | #287 | Tragic 96.8% |
| Immigrants | Afghanistan | 0.0 /100 | #288 | Tragic 96.8% |
| Immigrants | West Indies | 0.0 /100 | #289 | Tragic 96.7% |
| British West Indians | 0.0 /100 | #290 | Tragic 96.7% |
| Immigrants | Grenada | 0.0 /100 | #291 | Tragic 96.7% |
| Malaysians | 0.0 /100 | #292 | Tragic 96.7% |
| Puerto Ricans | 0.0 /100 | #293 | Tragic 96.7% |
| Immigrants | Eritrea | 0.0 /100 | #294 | Tragic 96.7% |
| Immigrants | Portugal | 0.0 /100 | #295 | Tragic 96.6% |
| Somalis | 0.0 /100 | #296 | Tragic 96.6% |
| Immigrants | Somalia | 0.0 /100 | #297 | Tragic 96.5% |
| Haitians | 0.0 /100 | #298 | Tragic 96.5% |
| Immigrants | Dominica | 0.0 /100 | #299 | Tragic 96.5% |
| Immigrants | South Eastern Asia | 0.0 /100 | #300 | Tragic 96.5% |
| Immigrants | Immigrants | 0.0 /100 | #301 | Tragic 96.5% |