Honduran vs Immigrants from Eritrea Master's Degree
COMPARE
Honduran
Immigrants from Eritrea
Master's Degree
Master's Degree Comparison
Hondurans
Immigrants from Eritrea
11.9%
MASTER'S DEGREE
0.2/ 100
METRIC RATING
283rd/ 347
METRIC RANK
16.4%
MASTER'S DEGREE
95.5/ 100
METRIC RATING
124th/ 347
METRIC RANK
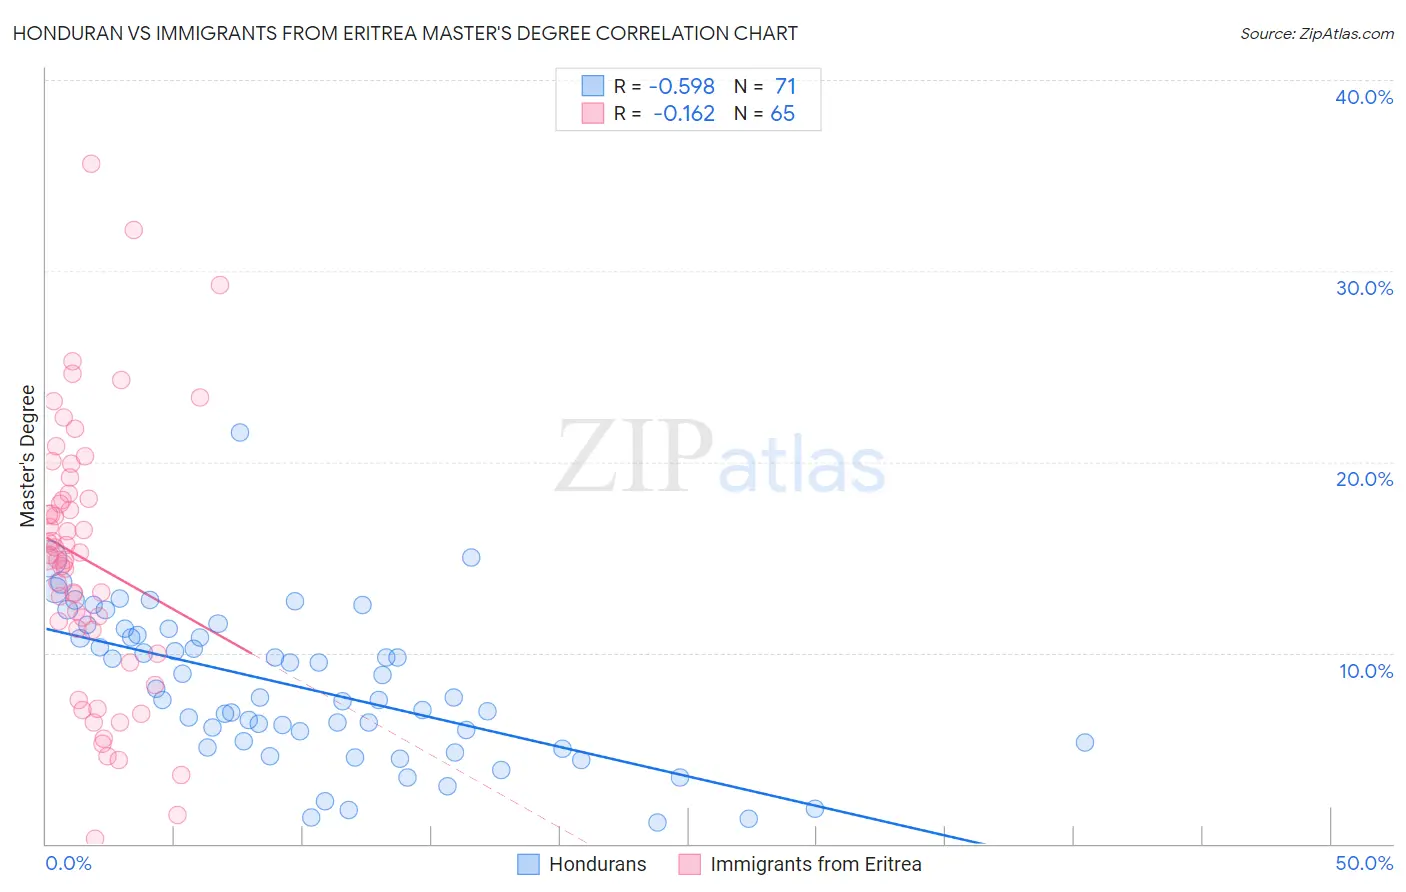
Honduran vs Immigrants from Eritrea Master's Degree Correlation Chart
The statistical analysis conducted on geographies consisting of 357,698,981 people shows a substantial negative correlation between the proportion of Hondurans and percentage of population with at least master's degree education in the United States with a correlation coefficient (R) of -0.598 and weighted average of 11.9%. Similarly, the statistical analysis conducted on geographies consisting of 104,847,630 people shows a poor negative correlation between the proportion of Immigrants from Eritrea and percentage of population with at least master's degree education in the United States with a correlation coefficient (R) of -0.162 and weighted average of 16.4%, a difference of 37.1%.
Master's Degree Correlation Summary
| Measurement | Honduran | Immigrants from Eritrea |
| Minimum | 1.1% | 0.25% |
| Maximum | 21.5% | 35.6% |
| Range | 20.4% | 35.4% |
| Mean | 8.2% | 14.8% |
| Median | 7.6% | 15.0% |
| Interquartile 25% (IQ1) | 5.3% | 10.6% |
| Interquartile 75% (IQ3) | 10.9% | 18.2% |
| Interquartile Range (IQR) | 5.6% | 7.6% |
| Standard Deviation (Sample) | 3.9% | 7.0% |
| Standard Deviation (Population) | 3.9% | 7.0% |
Similar Demographics by Master's Degree
Demographics Similar to Hondurans by Master's Degree
In terms of master's degree, the demographic groups most similar to Hondurans are Immigrants from El Salvador (12.0%, a difference of 0.41%), Malaysian (12.0%, a difference of 0.72%), Ottawa (11.9%, a difference of 0.72%), Immigrants from Dominican Republic (12.1%, a difference of 0.85%), and Immigrants from Belize (12.1%, a difference of 0.90%).
| Demographics | Rating | Rank | Master's Degree |
| Blacks/African Americans | 0.3 /100 | #276 | Tragic 12.1% |
| Immigrants | Caribbean | 0.3 /100 | #277 | Tragic 12.1% |
| Potawatomi | 0.3 /100 | #278 | Tragic 12.1% |
| Immigrants | Belize | 0.2 /100 | #279 | Tragic 12.1% |
| Immigrants | Dominican Republic | 0.2 /100 | #280 | Tragic 12.1% |
| Malaysians | 0.2 /100 | #281 | Tragic 12.0% |
| Immigrants | El Salvador | 0.2 /100 | #282 | Tragic 12.0% |
| Hondurans | 0.2 /100 | #283 | Tragic 11.9% |
| Ottawa | 0.2 /100 | #284 | Tragic 11.9% |
| Immigrants | Nicaragua | 0.2 /100 | #285 | Tragic 11.8% |
| Aleuts | 0.1 /100 | #286 | Tragic 11.8% |
| Immigrants | Haiti | 0.1 /100 | #287 | Tragic 11.8% |
| Immigrants | Honduras | 0.1 /100 | #288 | Tragic 11.8% |
| Guatemalans | 0.1 /100 | #289 | Tragic 11.7% |
| Ute | 0.1 /100 | #290 | Tragic 11.7% |
Demographics Similar to Immigrants from Eritrea by Master's Degree
In terms of master's degree, the demographic groups most similar to Immigrants from Eritrea are Croatian (16.4%, a difference of 0.070%), Italian (16.4%, a difference of 0.070%), British (16.4%, a difference of 0.080%), Immigrants from Eastern Africa (16.3%, a difference of 0.19%), and Palestinian (16.3%, a difference of 0.45%).
| Demographics | Rating | Rank | Master's Degree |
| Immigrants | Moldova | 97.2 /100 | #117 | Exceptional 16.6% |
| Brazilians | 96.8 /100 | #118 | Exceptional 16.5% |
| Jordanians | 96.5 /100 | #119 | Exceptional 16.5% |
| Lebanese | 96.4 /100 | #120 | Exceptional 16.5% |
| Afghans | 96.2 /100 | #121 | Exceptional 16.5% |
| British | 95.6 /100 | #122 | Exceptional 16.4% |
| Croatians | 95.6 /100 | #123 | Exceptional 16.4% |
| Immigrants | Eritrea | 95.5 /100 | #124 | Exceptional 16.4% |
| Italians | 95.4 /100 | #125 | Exceptional 16.4% |
| Immigrants | Eastern Africa | 95.2 /100 | #126 | Exceptional 16.3% |
| Palestinians | 94.8 /100 | #127 | Exceptional 16.3% |
| Immigrants | Sierra Leone | 94.7 /100 | #128 | Exceptional 16.3% |
| Immigrants | Syria | 93.3 /100 | #129 | Exceptional 16.2% |
| Immigrants | Jordan | 92.7 /100 | #130 | Exceptional 16.1% |
| Taiwanese | 91.9 /100 | #131 | Exceptional 16.1% |