Greek vs Hawaiian Single Male Poverty
COMPARE
Greek
Hawaiian
Single Male Poverty
Single Male Poverty Comparison
Greeks
Hawaiians
12.7%
SINGLE MALE POVERTY
64.1/ 100
METRIC RATING
160th/ 347
METRIC RANK
12.6%
SINGLE MALE POVERTY
75.1/ 100
METRIC RATING
144th/ 347
METRIC RANK
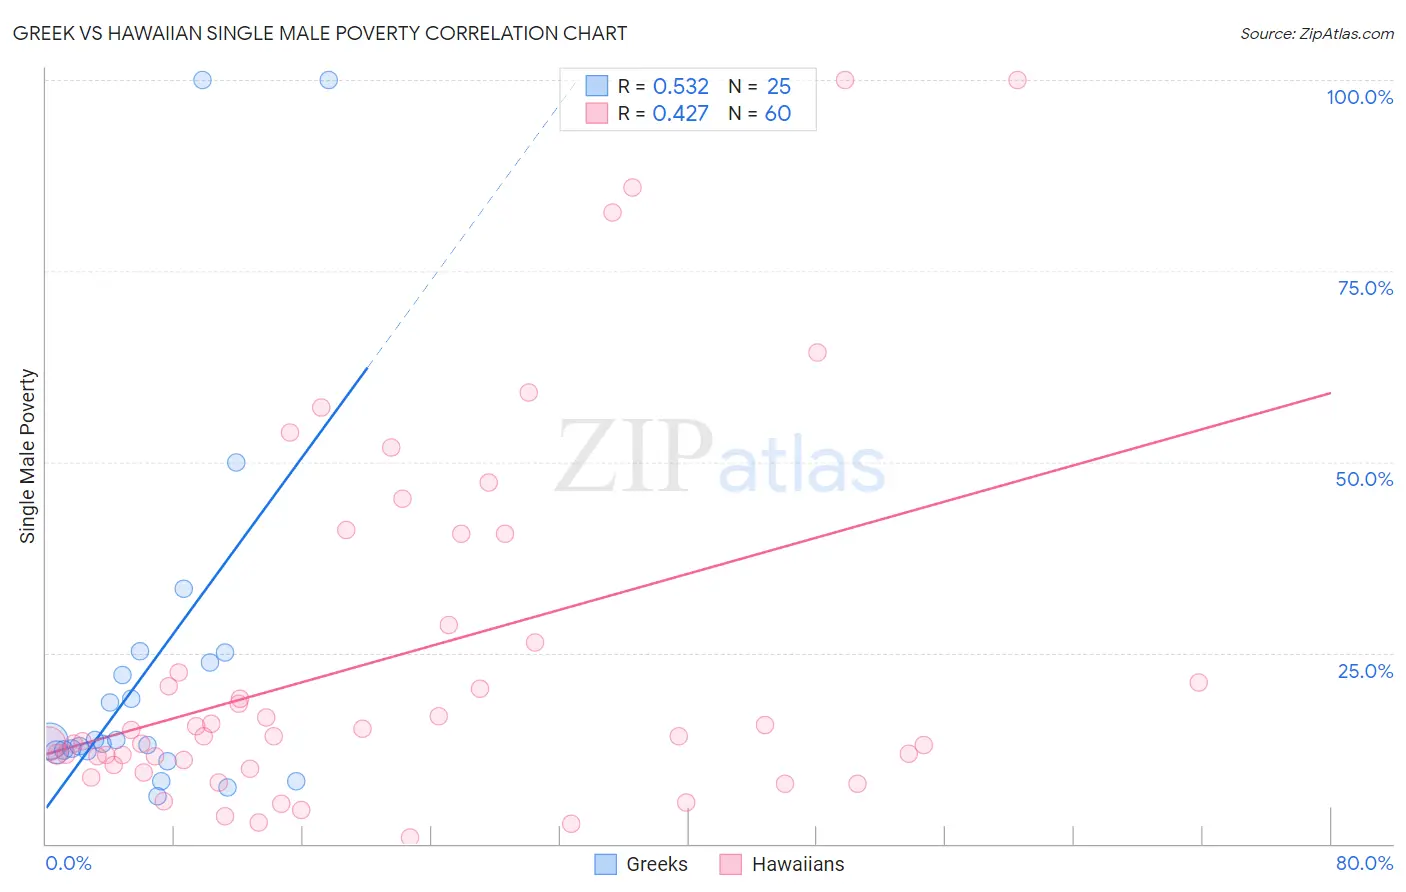
Greek vs Hawaiian Single Male Poverty Correlation Chart
The statistical analysis conducted on geographies consisting of 412,862,309 people shows a substantial positive correlation between the proportion of Greeks and poverty level among single males in the United States with a correlation coefficient (R) of 0.532 and weighted average of 12.7%. Similarly, the statistical analysis conducted on geographies consisting of 300,272,441 people shows a moderate positive correlation between the proportion of Hawaiians and poverty level among single males in the United States with a correlation coefficient (R) of 0.427 and weighted average of 12.6%, a difference of 0.70%.
Single Male Poverty Correlation Summary
| Measurement | Greek | Hawaiian |
| Minimum | 6.2% | 0.75% |
| Maximum | 100.0% | 100.0% |
| Range | 93.8% | 99.3% |
| Mean | 23.4% | 24.1% |
| Median | 13.4% | 14.1% |
| Interquartile 25% (IQ1) | 12.1% | 10.7% |
| Interquartile 75% (IQ3) | 24.4% | 27.4% |
| Interquartile Range (IQR) | 12.3% | 16.7% |
| Standard Deviation (Sample) | 24.9% | 24.0% |
| Standard Deviation (Population) | 24.4% | 23.8% |
Demographics Similar to Greeks and Hawaiians by Single Male Poverty
In terms of single male poverty, the demographic groups most similar to Greeks are Immigrants from Liberia (12.7%, a difference of 0.0%), Immigrants from Middle Africa (12.7%, a difference of 0.040%), Immigrants from Africa (12.7%, a difference of 0.040%), Eastern European (12.7%, a difference of 0.050%), and Vietnamese (12.7%, a difference of 0.23%). Similarly, the demographic groups most similar to Hawaiians are Immigrants from Lebanon (12.6%, a difference of 0.010%), Native Hawaiian (12.6%, a difference of 0.010%), Malaysian (12.6%, a difference of 0.020%), Immigrants from France (12.6%, a difference of 0.050%), and Immigrants from Uganda (12.6%, a difference of 0.060%).
| Demographics | Rating | Rank | Single Male Poverty |
| Immigrants | Uganda | 75.9 /100 | #142 | Good 12.6% |
| Immigrants | France | 75.8 /100 | #143 | Good 12.6% |
| Hawaiians | 75.1 /100 | #144 | Good 12.6% |
| Immigrants | Lebanon | 75.0 /100 | #145 | Good 12.6% |
| Native Hawaiians | 75.0 /100 | #146 | Good 12.6% |
| Malaysians | 74.8 /100 | #147 | Good 12.6% |
| Yugoslavians | 73.9 /100 | #148 | Good 12.6% |
| Sierra Leoneans | 73.0 /100 | #149 | Good 12.6% |
| Immigrants | Panama | 72.1 /100 | #150 | Good 12.6% |
| Immigrants | Hungary | 71.9 /100 | #151 | Good 12.6% |
| Australians | 71.4 /100 | #152 | Good 12.6% |
| Immigrants | Immigrants | 70.1 /100 | #153 | Good 12.7% |
| Immigrants | Scotland | 68.9 /100 | #154 | Good 12.7% |
| Immigrants | Spain | 68.7 /100 | #155 | Good 12.7% |
| Vietnamese | 67.9 /100 | #156 | Good 12.7% |
| Latvians | 67.9 /100 | #157 | Good 12.7% |
| Immigrants | Middle Africa | 64.9 /100 | #158 | Good 12.7% |
| Immigrants | Liberia | 64.2 /100 | #159 | Good 12.7% |
| Greeks | 64.1 /100 | #160 | Good 12.7% |
| Immigrants | Africa | 63.4 /100 | #161 | Good 12.7% |
| Eastern Europeans | 63.3 /100 | #162 | Good 12.7% |