Alaskan Athabascan vs Egyptian Single Mother Poverty
COMPARE
Alaskan Athabascan
Egyptian
Single Mother Poverty
Single Mother Poverty Comparison
Alaskan Athabascans
Egyptians
30.3%
SINGLE MOTHER POVERTY
4.1/ 100
METRIC RATING
232nd/ 347
METRIC RANK
26.9%
SINGLE MOTHER POVERTY
99.8/ 100
METRIC RATING
47th/ 347
METRIC RANK
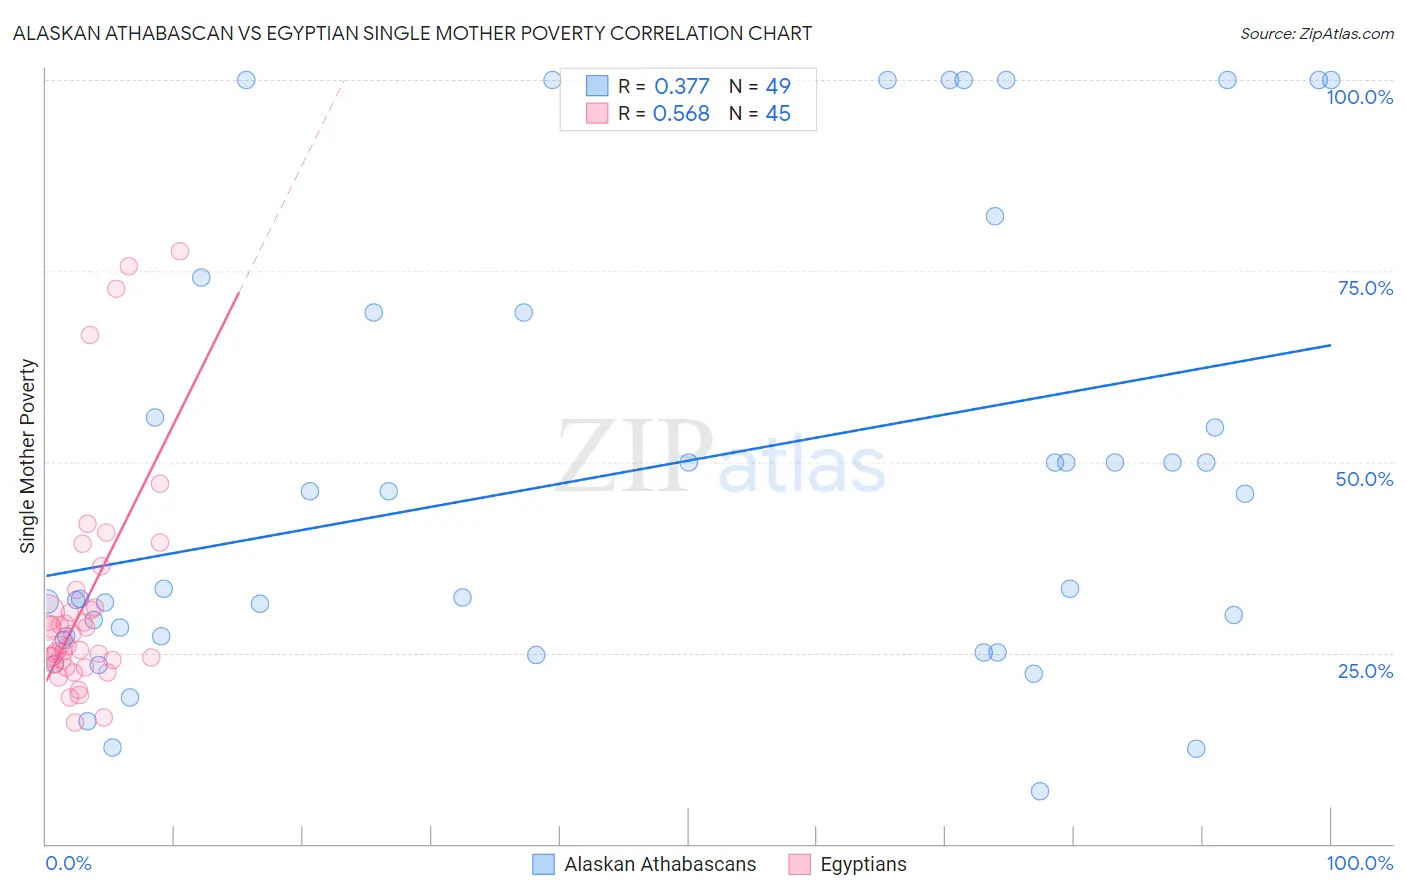
Alaskan Athabascan vs Egyptian Single Mother Poverty Correlation Chart
The statistical analysis conducted on geographies consisting of 45,529,547 people shows a mild positive correlation between the proportion of Alaskan Athabascans and poverty level among single mothers in the United States with a correlation coefficient (R) of 0.377 and weighted average of 30.3%. Similarly, the statistical analysis conducted on geographies consisting of 271,623,906 people shows a substantial positive correlation between the proportion of Egyptians and poverty level among single mothers in the United States with a correlation coefficient (R) of 0.568 and weighted average of 26.9%, a difference of 12.4%.
Single Mother Poverty Correlation Summary
| Measurement | Alaskan Athabascan | Egyptian |
| Minimum | 6.8% | 15.9% |
| Maximum | 100.0% | 77.6% |
| Range | 93.2% | 61.7% |
| Mean | 48.6% | 31.5% |
| Median | 33.3% | 26.1% |
| Interquartile 25% (IQ1) | 26.9% | 23.8% |
| Interquartile 75% (IQ3) | 69.6% | 32.1% |
| Interquartile Range (IQR) | 42.6% | 8.3% |
| Standard Deviation (Sample) | 29.3% | 14.7% |
| Standard Deviation (Population) | 29.0% | 14.6% |
Similar Demographics by Single Mother Poverty
Demographics Similar to Alaskan Athabascans by Single Mother Poverty
In terms of single mother poverty, the demographic groups most similar to Alaskan Athabascans are Dutch (30.2%, a difference of 0.040%), English (30.2%, a difference of 0.19%), Immigrants from Middle Africa (30.3%, a difference of 0.21%), Immigrants from Nicaragua (30.3%, a difference of 0.22%), and Immigrants from Barbados (30.2%, a difference of 0.23%).
| Demographics | Rating | Rank | Single Mother Poverty |
| Spanish | 6.3 /100 | #225 | Tragic 30.1% |
| Scottish | 6.0 /100 | #226 | Tragic 30.1% |
| Immigrants | Liberia | 5.9 /100 | #227 | Tragic 30.1% |
| Spaniards | 5.4 /100 | #228 | Tragic 30.2% |
| Immigrants | Barbados | 5.0 /100 | #229 | Tragic 30.2% |
| English | 4.8 /100 | #230 | Tragic 30.2% |
| Dutch | 4.3 /100 | #231 | Tragic 30.2% |
| Alaskan Athabascans | 4.1 /100 | #232 | Tragic 30.3% |
| Immigrants | Middle Africa | 3.5 /100 | #233 | Tragic 30.3% |
| Immigrants | Nicaragua | 3.5 /100 | #234 | Tragic 30.3% |
| Immigrants | Grenada | 3.4 /100 | #235 | Tragic 30.3% |
| Welsh | 3.2 /100 | #236 | Tragic 30.4% |
| Immigrants | St. Vincent and the Grenadines | 3.1 /100 | #237 | Tragic 30.4% |
| Slovaks | 2.8 /100 | #238 | Tragic 30.4% |
| Immigrants | Portugal | 2.1 /100 | #239 | Tragic 30.5% |
Demographics Similar to Egyptians by Single Mother Poverty
In terms of single mother poverty, the demographic groups most similar to Egyptians are Immigrants from Serbia (26.9%, a difference of 0.060%), Immigrants from Poland (26.9%, a difference of 0.080%), Latvian (26.9%, a difference of 0.10%), Cambodian (27.0%, a difference of 0.16%), and Laotian (27.0%, a difference of 0.17%).
| Demographics | Rating | Rank | Single Mother Poverty |
| Immigrants | Vietnam | 99.9 /100 | #40 | Exceptional 26.7% |
| Immigrants | Greece | 99.9 /100 | #41 | Exceptional 26.7% |
| Armenians | 99.9 /100 | #42 | Exceptional 26.8% |
| Tsimshian | 99.9 /100 | #43 | Exceptional 26.8% |
| Immigrants | Sierra Leone | 99.9 /100 | #44 | Exceptional 26.9% |
| Latvians | 99.9 /100 | #45 | Exceptional 26.9% |
| Immigrants | Serbia | 99.9 /100 | #46 | Exceptional 26.9% |
| Egyptians | 99.8 /100 | #47 | Exceptional 26.9% |
| Immigrants | Poland | 99.8 /100 | #48 | Exceptional 26.9% |
| Cambodians | 99.8 /100 | #49 | Exceptional 27.0% |
| Laotians | 99.8 /100 | #50 | Exceptional 27.0% |
| Immigrants | Argentina | 99.7 /100 | #51 | Exceptional 27.1% |
| Immigrants | South Eastern Asia | 99.7 /100 | #52 | Exceptional 27.1% |
| Immigrants | Jordan | 99.7 /100 | #53 | Exceptional 27.1% |
| Immigrants | Bulgaria | 99.7 /100 | #54 | Exceptional 27.1% |