Honduran vs Iranian Child Poverty Among Girls Under 16
COMPARE
Honduran
Iranian
Child Poverty Among Girls Under 16
Child Poverty Among Girls Under 16 Comparison
Hondurans
Iranians
22.2%
CHILD POVERTY AMONG GIRLS UNDER 16
0.0/ 100
METRIC RATING
320th/ 347
METRIC RANK
12.4%
CHILD POVERTY AMONG GIRLS UNDER 16
100.0/ 100
METRIC RATING
8th/ 347
METRIC RANK
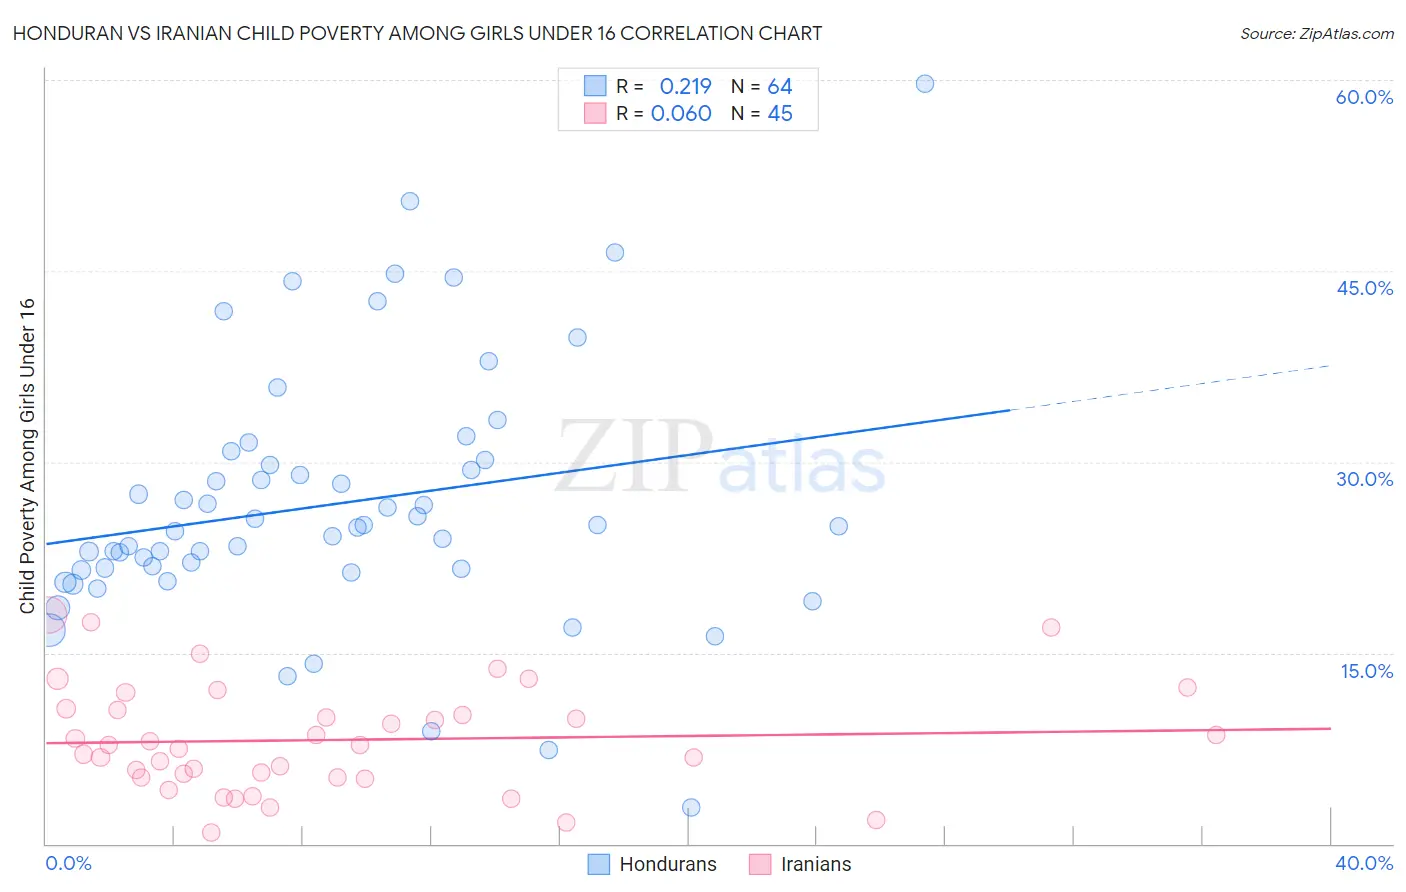
Honduran vs Iranian Child Poverty Among Girls Under 16 Correlation Chart
The statistical analysis conducted on geographies consisting of 354,249,736 people shows a weak positive correlation between the proportion of Hondurans and poverty level among girls under the age of 16 in the United States with a correlation coefficient (R) of 0.219 and weighted average of 22.2%. Similarly, the statistical analysis conducted on geographies consisting of 311,679,854 people shows a slight positive correlation between the proportion of Iranians and poverty level among girls under the age of 16 in the United States with a correlation coefficient (R) of 0.060 and weighted average of 12.4%, a difference of 79.2%.
Child Poverty Among Girls Under 16 Correlation Summary
| Measurement | Honduran | Iranian |
| Minimum | 2.8% | 0.88% |
| Maximum | 59.7% | 18.0% |
| Range | 56.9% | 17.1% |
| Mean | 26.7% | 8.2% |
| Median | 24.9% | 7.7% |
| Interquartile 25% (IQ1) | 21.5% | 5.2% |
| Interquartile 75% (IQ3) | 30.0% | 10.5% |
| Interquartile Range (IQR) | 8.4% | 5.3% |
| Standard Deviation (Sample) | 10.2% | 4.2% |
| Standard Deviation (Population) | 10.1% | 4.2% |
Similar Demographics by Child Poverty Among Girls Under 16
Demographics Similar to Hondurans by Child Poverty Among Girls Under 16
In terms of child poverty among girls under 16, the demographic groups most similar to Hondurans are U.S. Virgin Islander (22.1%, a difference of 0.60%), Immigrants from Dominica (22.1%, a difference of 0.76%), Colville (22.5%, a difference of 1.3%), African (21.9%, a difference of 1.4%), and Yakama (22.6%, a difference of 1.5%).
| Demographics | Rating | Rank | Child Poverty Among Girls Under 16 |
| Creek | 0.0 /100 | #313 | Tragic 21.7% |
| Arapaho | 0.0 /100 | #314 | Tragic 21.7% |
| Ute | 0.0 /100 | #315 | Tragic 21.8% |
| Immigrants | Guatemala | 0.0 /100 | #316 | Tragic 21.9% |
| Africans | 0.0 /100 | #317 | Tragic 21.9% |
| Immigrants | Dominica | 0.0 /100 | #318 | Tragic 22.1% |
| U.S. Virgin Islanders | 0.0 /100 | #319 | Tragic 22.1% |
| Hondurans | 0.0 /100 | #320 | Tragic 22.2% |
| Colville | 0.0 /100 | #321 | Tragic 22.5% |
| Yakama | 0.0 /100 | #322 | Tragic 22.6% |
| Cajuns | 0.0 /100 | #323 | Tragic 22.6% |
| Paiute | 0.0 /100 | #324 | Tragic 22.6% |
| Immigrants | Congo | 0.0 /100 | #325 | Tragic 22.7% |
| Immigrants | Honduras | 0.0 /100 | #326 | Tragic 22.8% |
| Central American Indians | 0.0 /100 | #327 | Tragic 22.8% |
Demographics Similar to Iranians by Child Poverty Among Girls Under 16
In terms of child poverty among girls under 16, the demographic groups most similar to Iranians are Immigrants from Singapore (12.5%, a difference of 0.43%), Chinese (12.3%, a difference of 0.53%), Immigrants from Hong Kong (12.3%, a difference of 0.66%), Immigrants from Iran (12.6%, a difference of 1.4%), and Immigrants from South Central Asia (12.7%, a difference of 2.6%).
| Demographics | Rating | Rank | Child Poverty Among Girls Under 16 |
| Immigrants | India | 100.0 /100 | #1 | Exceptional 11.0% |
| Immigrants | Taiwan | 100.0 /100 | #2 | Exceptional 11.3% |
| Filipinos | 100.0 /100 | #3 | Exceptional 11.4% |
| Tsimshian | 100.0 /100 | #4 | Exceptional 11.5% |
| Thais | 100.0 /100 | #5 | Exceptional 11.8% |
| Immigrants | Hong Kong | 100.0 /100 | #6 | Exceptional 12.3% |
| Chinese | 100.0 /100 | #7 | Exceptional 12.3% |
| Iranians | 100.0 /100 | #8 | Exceptional 12.4% |
| Immigrants | Singapore | 100.0 /100 | #9 | Exceptional 12.5% |
| Immigrants | Iran | 100.0 /100 | #10 | Exceptional 12.6% |
| Immigrants | South Central Asia | 100.0 /100 | #11 | Exceptional 12.7% |
| Bhutanese | 100.0 /100 | #12 | Exceptional 12.7% |
| Immigrants | Ireland | 99.9 /100 | #13 | Exceptional 12.9% |
| Burmese | 99.9 /100 | #14 | Exceptional 13.0% |
| Okinawans | 99.9 /100 | #15 | Exceptional 13.0% |