Honduran vs Basque In Labor Force | Age 35-44
COMPARE
Honduran
Basque
In Labor Force | Age 35-44
In Labor Force | Age 35-44 Comparison
Hondurans
Basques
83.4%
IN LABOR FORCE | AGE 35-44
0.1/ 100
METRIC RATING
268th/ 347
METRIC RANK
83.6%
IN LABOR FORCE | AGE 35-44
0.3/ 100
METRIC RATING
257th/ 347
METRIC RANK
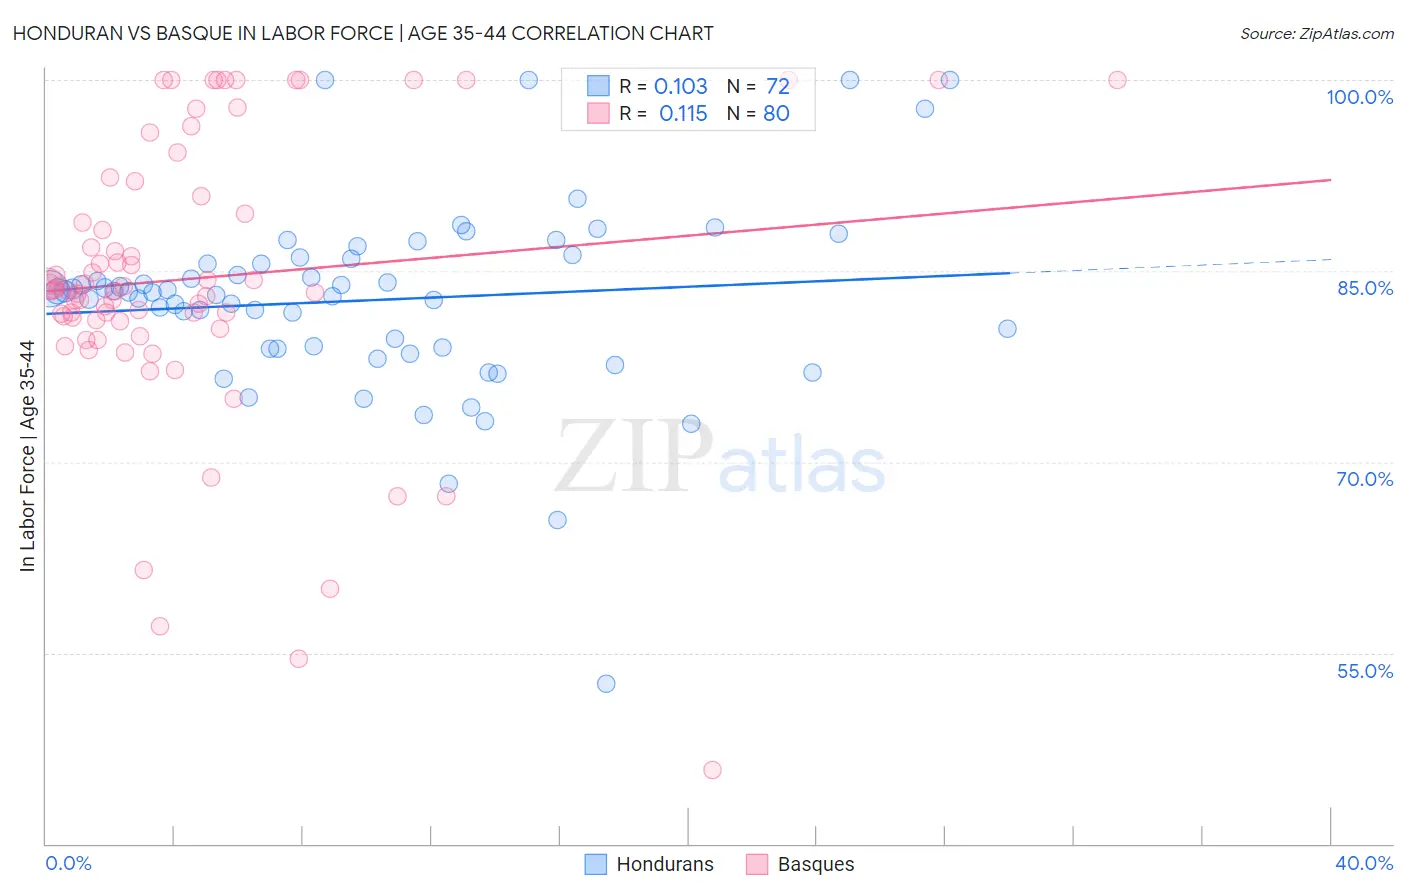
Honduran vs Basque In Labor Force | Age 35-44 Correlation Chart
The statistical analysis conducted on geographies consisting of 357,674,403 people shows a poor positive correlation between the proportion of Hondurans and labor force participation rate among population between the ages 35 and 44 in the United States with a correlation coefficient (R) of 0.103 and weighted average of 83.4%. Similarly, the statistical analysis conducted on geographies consisting of 165,759,018 people shows a poor positive correlation between the proportion of Basques and labor force participation rate among population between the ages 35 and 44 in the United States with a correlation coefficient (R) of 0.115 and weighted average of 83.6%, a difference of 0.25%.
In Labor Force | Age 35-44 Correlation Summary
| Measurement | Honduran | Basque |
| Minimum | 52.6% | 45.8% |
| Maximum | 100.0% | 100.0% |
| Range | 47.4% | 54.2% |
| Mean | 82.7% | 84.4% |
| Median | 83.4% | 83.5% |
| Interquartile 25% (IQ1) | 79.0% | 81.1% |
| Interquartile 75% (IQ3) | 85.8% | 91.4% |
| Interquartile Range (IQR) | 6.8% | 10.3% |
| Standard Deviation (Sample) | 7.5% | 11.1% |
| Standard Deviation (Population) | 7.4% | 11.0% |
Demographics Similar to Hondurans and Basques by In Labor Force | Age 35-44
In terms of in labor force | age 35-44, the demographic groups most similar to Hondurans are Immigrants from Grenada (83.3%, a difference of 0.010%), Guamanian/Chamorro (83.4%, a difference of 0.030%), Spaniard (83.4%, a difference of 0.080%), Scotch-Irish (83.5%, a difference of 0.12%), and Central American (83.5%, a difference of 0.12%). Similarly, the demographic groups most similar to Basques are Japanese (83.6%, a difference of 0.020%), Tsimshian (83.5%, a difference of 0.020%), Immigrants from the Azores (83.6%, a difference of 0.030%), Immigrants from El Salvador (83.5%, a difference of 0.050%), and Tongan (83.6%, a difference of 0.060%).
| Demographics | Rating | Rank | In Labor Force | Age 35-44 |
| Immigrants | Guyana | 0.4 /100 | #252 | Tragic 83.6% |
| Lebanese | 0.4 /100 | #253 | Tragic 83.6% |
| Tongans | 0.4 /100 | #254 | Tragic 83.6% |
| Immigrants | Azores | 0.3 /100 | #255 | Tragic 83.6% |
| Japanese | 0.3 /100 | #256 | Tragic 83.6% |
| Basques | 0.3 /100 | #257 | Tragic 83.6% |
| Tsimshian | 0.2 /100 | #258 | Tragic 83.5% |
| Immigrants | El Salvador | 0.2 /100 | #259 | Tragic 83.5% |
| Vietnamese | 0.2 /100 | #260 | Tragic 83.5% |
| Immigrants | Dominica | 0.2 /100 | #261 | Tragic 83.5% |
| Immigrants | Congo | 0.2 /100 | #262 | Tragic 83.5% |
| Iroquois | 0.2 /100 | #263 | Tragic 83.5% |
| Scotch-Irish | 0.1 /100 | #264 | Tragic 83.5% |
| Central Americans | 0.1 /100 | #265 | Tragic 83.5% |
| Spaniards | 0.1 /100 | #266 | Tragic 83.4% |
| Guamanians/Chamorros | 0.1 /100 | #267 | Tragic 83.4% |
| Hondurans | 0.1 /100 | #268 | Tragic 83.4% |
| Immigrants | Grenada | 0.1 /100 | #269 | Tragic 83.3% |
| Immigrants | Honduras | 0.0 /100 | #270 | Tragic 83.3% |
| French American Indians | 0.0 /100 | #271 | Tragic 83.2% |
| Immigrants | Fiji | 0.0 /100 | #272 | Tragic 83.2% |