Hmong vs Immigrants from England Female Poverty Among 25-34 Year Olds
COMPARE
Hmong
Immigrants from England
Female Poverty Among 25-34 Year Olds
Female Poverty Among 25-34 Year Olds Comparison
Hmong
Immigrants from England
13.9%
FEMALE POVERTY AMONG 25-34 YEAR OLDS
20.3/ 100
METRIC RATING
200th/ 347
METRIC RANK
13.0%
FEMALE POVERTY AMONG 25-34 YEAR OLDS
85.5/ 100
METRIC RATING
136th/ 347
METRIC RANK
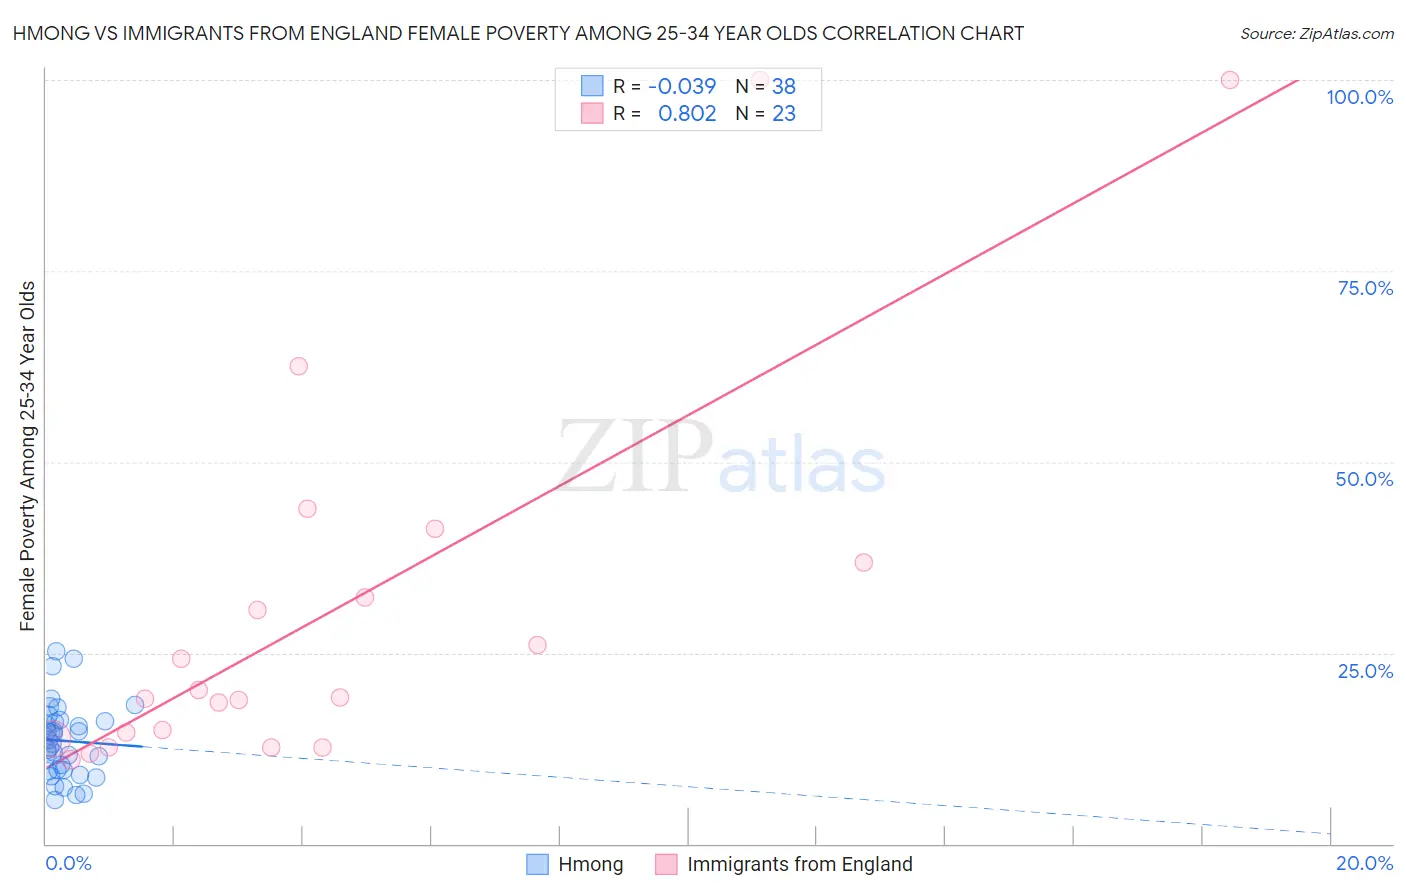
Hmong vs Immigrants from England Female Poverty Among 25-34 Year Olds Correlation Chart
The statistical analysis conducted on geographies consisting of 24,665,779 people shows no correlation between the proportion of Hmong and poverty level among females between the ages 25 and 34 in the United States with a correlation coefficient (R) of -0.039 and weighted average of 13.9%. Similarly, the statistical analysis conducted on geographies consisting of 384,281,453 people shows a very strong positive correlation between the proportion of Immigrants from England and poverty level among females between the ages 25 and 34 in the United States with a correlation coefficient (R) of 0.802 and weighted average of 13.0%, a difference of 6.8%.
Female Poverty Among 25-34 Year Olds Correlation Summary
| Measurement | Hmong | Immigrants from England |
| Minimum | 5.8% | 11.0% |
| Maximum | 25.3% | 100.0% |
| Range | 19.5% | 89.0% |
| Mean | 13.5% | 30.3% |
| Median | 13.3% | 19.1% |
| Interquartile 25% (IQ1) | 9.6% | 13.7% |
| Interquartile 75% (IQ3) | 16.0% | 36.8% |
| Interquartile Range (IQR) | 6.4% | 23.1% |
| Standard Deviation (Sample) | 4.8% | 25.4% |
| Standard Deviation (Population) | 4.7% | 24.8% |
Similar Demographics by Female Poverty Among 25-34 Year Olds
Demographics Similar to Hmong by Female Poverty Among 25-34 Year Olds
In terms of female poverty among 25-34 year olds, the demographic groups most similar to Hmong are English (13.9%, a difference of 0.020%), Immigrants from Germany (13.9%, a difference of 0.080%), Immigrants from Saudi Arabia (13.9%, a difference of 0.19%), Immigrants from Trinidad and Tobago (14.0%, a difference of 0.35%), and Scottish (13.9%, a difference of 0.39%).
| Demographics | Rating | Rank | Female Poverty Among 25-34 Year Olds |
| Immigrants | Kenya | 28.0 /100 | #193 | Fair 13.8% |
| Moroccans | 25.1 /100 | #194 | Fair 13.8% |
| Immigrants | Cambodia | 24.0 /100 | #195 | Fair 13.9% |
| Scottish | 23.6 /100 | #196 | Fair 13.9% |
| Immigrants | Saudi Arabia | 21.9 /100 | #197 | Fair 13.9% |
| Immigrants | Germany | 20.9 /100 | #198 | Fair 13.9% |
| English | 20.4 /100 | #199 | Fair 13.9% |
| Hmong | 20.3 /100 | #200 | Fair 13.9% |
| Immigrants | Trinidad and Tobago | 17.6 /100 | #201 | Poor 14.0% |
| Welsh | 17.2 /100 | #202 | Poor 14.0% |
| Immigrants | Immigrants | 14.5 /100 | #203 | Poor 14.0% |
| Hawaiians | 13.6 /100 | #204 | Poor 14.1% |
| Immigrants | Africa | 13.4 /100 | #205 | Poor 14.1% |
| Hungarians | 11.8 /100 | #206 | Poor 14.1% |
| Japanese | 11.7 /100 | #207 | Poor 14.1% |
Demographics Similar to Immigrants from England by Female Poverty Among 25-34 Year Olds
In terms of female poverty among 25-34 year olds, the demographic groups most similar to Immigrants from England are South African (13.0%, a difference of 0.020%), Afghan (13.0%, a difference of 0.040%), Immigrants from Chile (13.1%, a difference of 0.16%), Brazilian (13.1%, a difference of 0.17%), and Austrian (13.1%, a difference of 0.30%).
| Demographics | Rating | Rank | Female Poverty Among 25-34 Year Olds |
| Immigrants | North America | 89.7 /100 | #129 | Excellent 12.9% |
| Immigrants | Uzbekistan | 89.6 /100 | #130 | Excellent 12.9% |
| Pakistanis | 88.4 /100 | #131 | Excellent 13.0% |
| Immigrants | Hungary | 88.3 /100 | #132 | Excellent 13.0% |
| Serbians | 87.6 /100 | #133 | Excellent 13.0% |
| Afghans | 85.8 /100 | #134 | Excellent 13.0% |
| South Africans | 85.7 /100 | #135 | Excellent 13.0% |
| Immigrants | England | 85.5 /100 | #136 | Excellent 13.0% |
| Immigrants | Chile | 84.6 /100 | #137 | Excellent 13.1% |
| Brazilians | 84.5 /100 | #138 | Excellent 13.1% |
| Austrians | 83.7 /100 | #139 | Excellent 13.1% |
| Immigrants | Iraq | 83.6 /100 | #140 | Excellent 13.1% |
| New Zealanders | 83.4 /100 | #141 | Excellent 13.1% |
| Scandinavians | 82.3 /100 | #142 | Excellent 13.1% |
| Israelis | 81.9 /100 | #143 | Excellent 13.1% |