French American Indian vs Yaqui Female Poverty Among 25-34 Year Olds
COMPARE
French American Indian
Yaqui
Female Poverty Among 25-34 Year Olds
Female Poverty Among 25-34 Year Olds Comparison
French American Indians
Yaqui
15.9%
FEMALE POVERTY AMONG 25-34 YEAR OLDS
0.0/ 100
METRIC RATING
278th/ 347
METRIC RANK
17.0%
FEMALE POVERTY AMONG 25-34 YEAR OLDS
0.0/ 100
METRIC RATING
307th/ 347
METRIC RANK
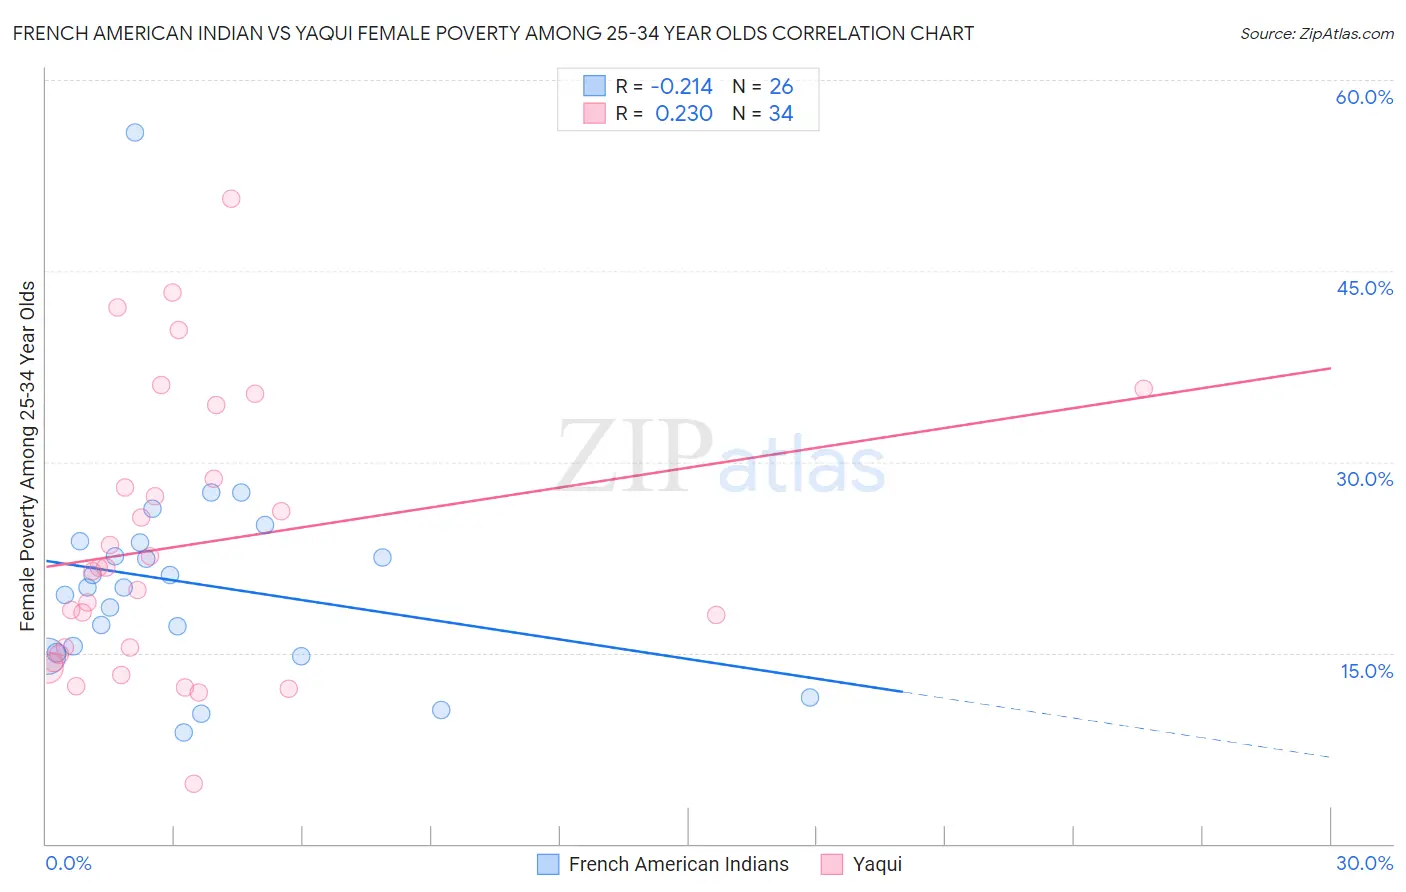
French American Indian vs Yaqui Female Poverty Among 25-34 Year Olds Correlation Chart
The statistical analysis conducted on geographies consisting of 131,099,782 people shows a weak negative correlation between the proportion of French American Indians and poverty level among females between the ages 25 and 34 in the United States with a correlation coefficient (R) of -0.214 and weighted average of 15.9%. Similarly, the statistical analysis conducted on geographies consisting of 107,367,613 people shows a weak positive correlation between the proportion of Yaqui and poverty level among females between the ages 25 and 34 in the United States with a correlation coefficient (R) of 0.230 and weighted average of 17.0%, a difference of 7.1%.
Female Poverty Among 25-34 Year Olds Correlation Summary
| Measurement | French American Indian | Yaqui |
| Minimum | 8.8% | 4.8% |
| Maximum | 55.9% | 50.6% |
| Range | 47.1% | 45.9% |
| Mean | 20.5% | 23.5% |
| Median | 20.1% | 21.5% |
| Interquartile 25% (IQ1) | 15.0% | 14.9% |
| Interquartile 75% (IQ3) | 23.6% | 28.7% |
| Interquartile Range (IQR) | 8.7% | 13.8% |
| Standard Deviation (Sample) | 9.0% | 10.9% |
| Standard Deviation (Population) | 8.8% | 10.7% |
Similar Demographics by Female Poverty Among 25-34 Year Olds
Demographics Similar to French American Indians by Female Poverty Among 25-34 Year Olds
In terms of female poverty among 25-34 year olds, the demographic groups most similar to French American Indians are Fijian (15.9%, a difference of 0.0%), Bangladeshi (15.9%, a difference of 0.16%), Immigrants from Micronesia (15.8%, a difference of 0.29%), Immigrants from Zaire (15.8%, a difference of 0.30%), and Immigrants from Latin America (16.0%, a difference of 0.67%).
| Demographics | Rating | Rank | Female Poverty Among 25-34 Year Olds |
| Cree | 0.1 /100 | #271 | Tragic 15.6% |
| Senegalese | 0.1 /100 | #272 | Tragic 15.6% |
| Immigrants | Nonimmigrants | 0.1 /100 | #273 | Tragic 15.6% |
| Immigrants | Caribbean | 0.0 /100 | #274 | Tragic 15.7% |
| Immigrants | Azores | 0.0 /100 | #275 | Tragic 15.8% |
| Immigrants | Zaire | 0.0 /100 | #276 | Tragic 15.8% |
| Immigrants | Micronesia | 0.0 /100 | #277 | Tragic 15.8% |
| French American Indians | 0.0 /100 | #278 | Tragic 15.9% |
| Fijians | 0.0 /100 | #279 | Tragic 15.9% |
| Bangladeshis | 0.0 /100 | #280 | Tragic 15.9% |
| Immigrants | Latin America | 0.0 /100 | #281 | Tragic 16.0% |
| Aleuts | 0.0 /100 | #282 | Tragic 16.1% |
| Bahamians | 0.0 /100 | #283 | Tragic 16.1% |
| Shoshone | 0.0 /100 | #284 | Tragic 16.2% |
| Immigrants | Bahamas | 0.0 /100 | #285 | Tragic 16.3% |
Demographics Similar to Yaqui by Female Poverty Among 25-34 Year Olds
In terms of female poverty among 25-34 year olds, the demographic groups most similar to Yaqui are Chickasaw (17.0%, a difference of 0.020%), African (17.0%, a difference of 0.20%), Ottawa (17.1%, a difference of 0.50%), Immigrants from Cabo Verde (16.9%, a difference of 0.60%), and Honduran (16.9%, a difference of 0.76%).
| Demographics | Rating | Rank | Female Poverty Among 25-34 Year Olds |
| U.S. Virgin Islanders | 0.0 /100 | #300 | Tragic 16.7% |
| Immigrants | Congo | 0.0 /100 | #301 | Tragic 16.7% |
| Alaska Natives | 0.0 /100 | #302 | Tragic 16.8% |
| Immigrants | Mexico | 0.0 /100 | #303 | Tragic 16.8% |
| Hondurans | 0.0 /100 | #304 | Tragic 16.9% |
| Immigrants | Cabo Verde | 0.0 /100 | #305 | Tragic 16.9% |
| Chickasaw | 0.0 /100 | #306 | Tragic 17.0% |
| Yaqui | 0.0 /100 | #307 | Tragic 17.0% |
| Africans | 0.0 /100 | #308 | Tragic 17.0% |
| Ottawa | 0.0 /100 | #309 | Tragic 17.1% |
| Cherokee | 0.0 /100 | #310 | Tragic 17.2% |
| Immigrants | Honduras | 0.0 /100 | #311 | Tragic 17.3% |
| Iroquois | 0.0 /100 | #312 | Tragic 17.5% |
| Colville | 0.0 /100 | #313 | Tragic 17.5% |
| Immigrants | Dominican Republic | 0.0 /100 | #314 | Tragic 17.6% |