Hmong vs Ghanaian Female Poverty Among 25-34 Year Olds
COMPARE
Hmong
Ghanaian
Female Poverty Among 25-34 Year Olds
Female Poverty Among 25-34 Year Olds Comparison
Hmong
Ghanaians
13.9%
FEMALE POVERTY AMONG 25-34 YEAR OLDS
20.3/ 100
METRIC RATING
200th/ 347
METRIC RANK
14.4%
FEMALE POVERTY AMONG 25-34 YEAR OLDS
4.8/ 100
METRIC RATING
220th/ 347
METRIC RANK
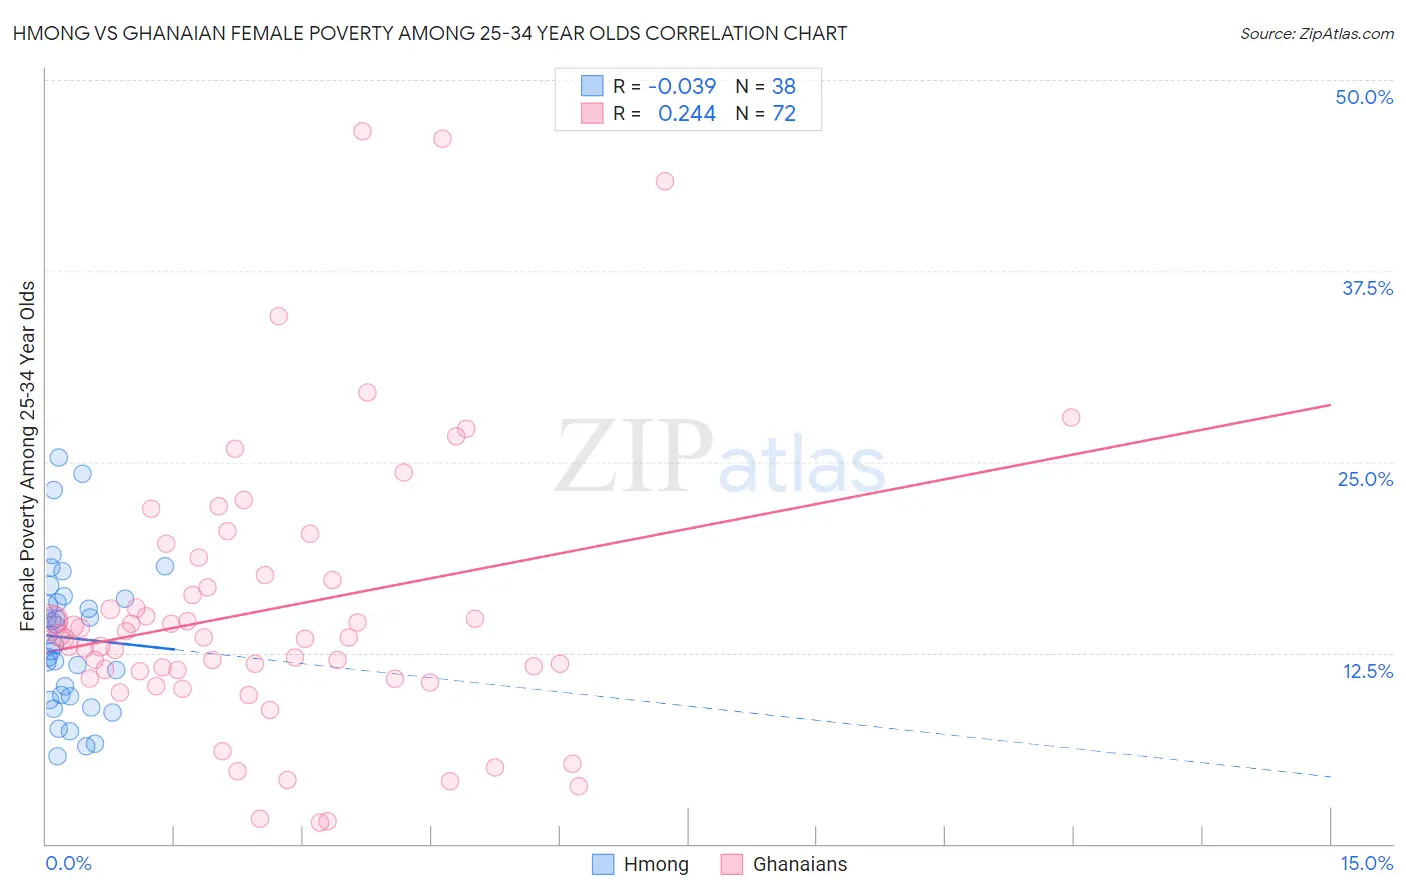
Hmong vs Ghanaian Female Poverty Among 25-34 Year Olds Correlation Chart
The statistical analysis conducted on geographies consisting of 24,665,779 people shows no correlation between the proportion of Hmong and poverty level among females between the ages 25 and 34 in the United States with a correlation coefficient (R) of -0.039 and weighted average of 13.9%. Similarly, the statistical analysis conducted on geographies consisting of 189,437,632 people shows a weak positive correlation between the proportion of Ghanaians and poverty level among females between the ages 25 and 34 in the United States with a correlation coefficient (R) of 0.244 and weighted average of 14.4%, a difference of 3.3%.
Female Poverty Among 25-34 Year Olds Correlation Summary
| Measurement | Hmong | Ghanaian |
| Minimum | 5.8% | 1.4% |
| Maximum | 25.3% | 46.7% |
| Range | 19.5% | 45.2% |
| Mean | 13.5% | 15.3% |
| Median | 13.3% | 13.5% |
| Interquartile 25% (IQ1) | 9.6% | 11.1% |
| Interquartile 75% (IQ3) | 16.0% | 17.4% |
| Interquartile Range (IQR) | 6.4% | 6.3% |
| Standard Deviation (Sample) | 4.8% | 9.1% |
| Standard Deviation (Population) | 4.7% | 9.1% |
Demographics Similar to Hmong and Ghanaians by Female Poverty Among 25-34 Year Olds
In terms of female poverty among 25-34 year olds, the demographic groups most similar to Hmong are Immigrants from Trinidad and Tobago (14.0%, a difference of 0.35%), Welsh (14.0%, a difference of 0.41%), Immigrants (14.0%, a difference of 0.82%), Hawaiian (14.1%, a difference of 0.97%), and Immigrants from Africa (14.1%, a difference of 1.0%). Similarly, the demographic groups most similar to Ghanaians are Ecuadorian (14.3%, a difference of 0.16%), Immigrants from Thailand (14.3%, a difference of 0.17%), French Canadian (14.3%, a difference of 0.28%), Spanish American Indian (14.3%, a difference of 0.28%), and Immigrants from Nigeria (14.3%, a difference of 0.53%).
| Demographics | Rating | Rank | Female Poverty Among 25-34 Year Olds |
| Hmong | 20.3 /100 | #200 | Fair 13.9% |
| Immigrants | Trinidad and Tobago | 17.6 /100 | #201 | Poor 14.0% |
| Welsh | 17.2 /100 | #202 | Poor 14.0% |
| Immigrants | Immigrants | 14.5 /100 | #203 | Poor 14.0% |
| Hawaiians | 13.6 /100 | #204 | Poor 14.1% |
| Immigrants | Africa | 13.4 /100 | #205 | Poor 14.1% |
| Hungarians | 11.8 /100 | #206 | Poor 14.1% |
| Japanese | 11.7 /100 | #207 | Poor 14.1% |
| Immigrants | Panama | 11.6 /100 | #208 | Poor 14.1% |
| Guyanese | 8.6 /100 | #209 | Tragic 14.2% |
| Panamanians | 8.6 /100 | #210 | Tragic 14.2% |
| Trinidadians and Tobagonians | 8.2 /100 | #211 | Tragic 14.2% |
| Immigrants | Guyana | 6.6 /100 | #212 | Tragic 14.3% |
| Puget Sound Salish | 6.5 /100 | #213 | Tragic 14.3% |
| French | 6.2 /100 | #214 | Tragic 14.3% |
| Immigrants | Nigeria | 6.2 /100 | #215 | Tragic 14.3% |
| French Canadians | 5.5 /100 | #216 | Tragic 14.3% |
| Spanish American Indians | 5.5 /100 | #217 | Tragic 14.3% |
| Immigrants | Thailand | 5.2 /100 | #218 | Tragic 14.3% |
| Ecuadorians | 5.2 /100 | #219 | Tragic 14.3% |
| Ghanaians | 4.8 /100 | #220 | Tragic 14.4% |