Hmong vs Immigrants from Italy Female Poverty Among 25-34 Year Olds
COMPARE
Hmong
Immigrants from Italy
Female Poverty Among 25-34 Year Olds
Female Poverty Among 25-34 Year Olds Comparison
Hmong
Immigrants from Italy
13.9%
FEMALE POVERTY AMONG 25-34 YEAR OLDS
20.3/ 100
METRIC RATING
200th/ 347
METRIC RANK
12.3%
FEMALE POVERTY AMONG 25-34 YEAR OLDS
98.8/ 100
METRIC RATING
77th/ 347
METRIC RANK
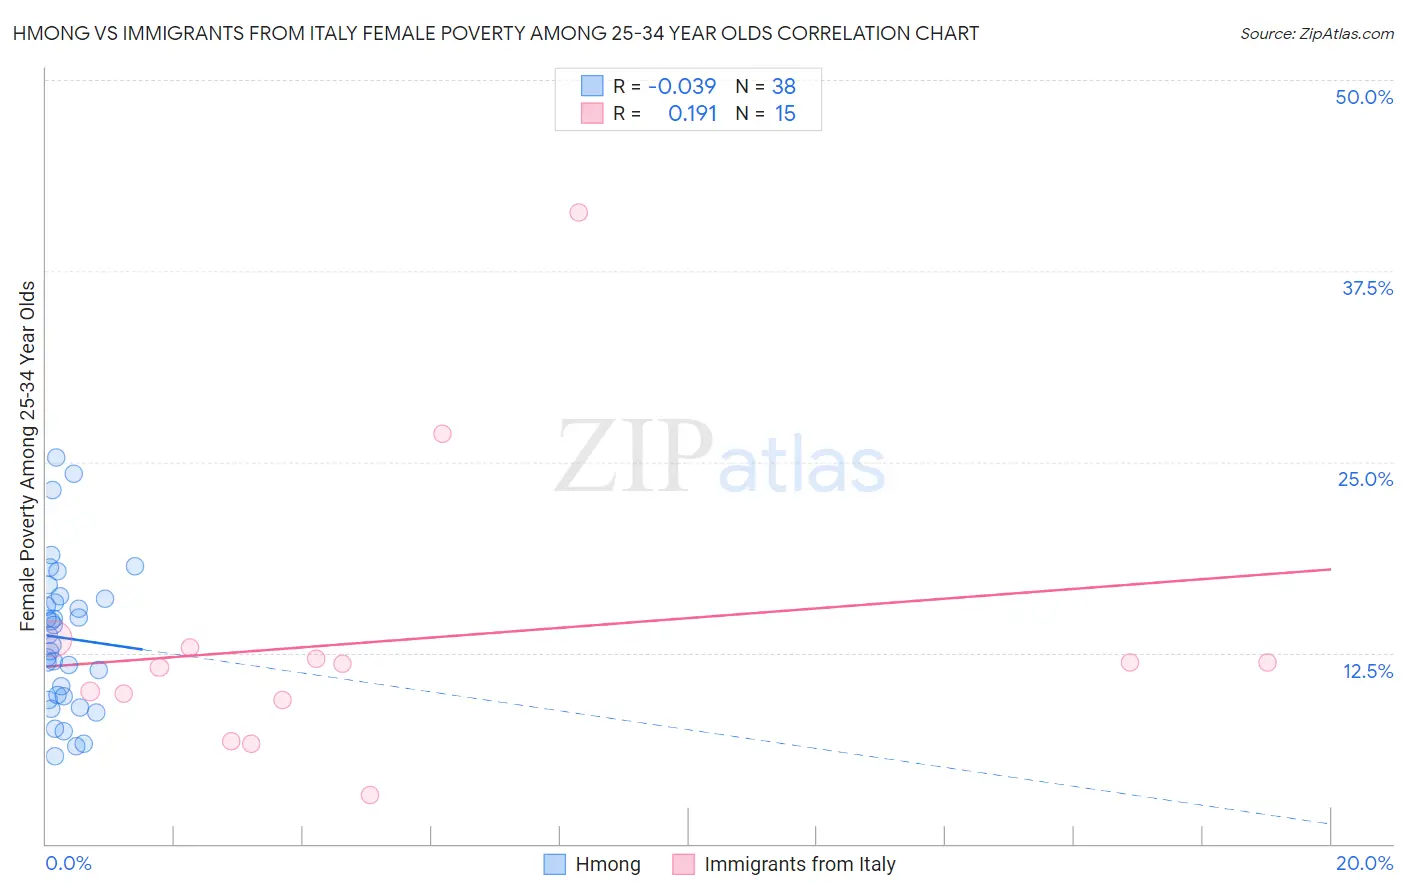
Hmong vs Immigrants from Italy Female Poverty Among 25-34 Year Olds Correlation Chart
The statistical analysis conducted on geographies consisting of 24,665,779 people shows no correlation between the proportion of Hmong and poverty level among females between the ages 25 and 34 in the United States with a correlation coefficient (R) of -0.039 and weighted average of 13.9%. Similarly, the statistical analysis conducted on geographies consisting of 318,337,558 people shows a poor positive correlation between the proportion of Immigrants from Italy and poverty level among females between the ages 25 and 34 in the United States with a correlation coefficient (R) of 0.191 and weighted average of 12.3%, a difference of 13.2%.
Female Poverty Among 25-34 Year Olds Correlation Summary
| Measurement | Hmong | Immigrants from Italy |
| Minimum | 5.8% | 3.2% |
| Maximum | 25.3% | 41.3% |
| Range | 19.5% | 38.1% |
| Mean | 13.5% | 13.3% |
| Median | 13.3% | 11.8% |
| Interquartile 25% (IQ1) | 9.6% | 9.4% |
| Interquartile 75% (IQ3) | 16.0% | 12.9% |
| Interquartile Range (IQR) | 6.4% | 3.5% |
| Standard Deviation (Sample) | 4.8% | 9.3% |
| Standard Deviation (Population) | 4.7% | 9.0% |
Similar Demographics by Female Poverty Among 25-34 Year Olds
Demographics Similar to Hmong by Female Poverty Among 25-34 Year Olds
In terms of female poverty among 25-34 year olds, the demographic groups most similar to Hmong are English (13.9%, a difference of 0.020%), Immigrants from Germany (13.9%, a difference of 0.080%), Immigrants from Saudi Arabia (13.9%, a difference of 0.19%), Immigrants from Trinidad and Tobago (14.0%, a difference of 0.35%), and Scottish (13.9%, a difference of 0.39%).
| Demographics | Rating | Rank | Female Poverty Among 25-34 Year Olds |
| Immigrants | Kenya | 28.0 /100 | #193 | Fair 13.8% |
| Moroccans | 25.1 /100 | #194 | Fair 13.8% |
| Immigrants | Cambodia | 24.0 /100 | #195 | Fair 13.9% |
| Scottish | 23.6 /100 | #196 | Fair 13.9% |
| Immigrants | Saudi Arabia | 21.9 /100 | #197 | Fair 13.9% |
| Immigrants | Germany | 20.9 /100 | #198 | Fair 13.9% |
| English | 20.4 /100 | #199 | Fair 13.9% |
| Hmong | 20.3 /100 | #200 | Fair 13.9% |
| Immigrants | Trinidad and Tobago | 17.6 /100 | #201 | Poor 14.0% |
| Welsh | 17.2 /100 | #202 | Poor 14.0% |
| Immigrants | Immigrants | 14.5 /100 | #203 | Poor 14.0% |
| Hawaiians | 13.6 /100 | #204 | Poor 14.1% |
| Immigrants | Africa | 13.4 /100 | #205 | Poor 14.1% |
| Hungarians | 11.8 /100 | #206 | Poor 14.1% |
| Japanese | 11.7 /100 | #207 | Poor 14.1% |
Demographics Similar to Immigrants from Italy by Female Poverty Among 25-34 Year Olds
In terms of female poverty among 25-34 year olds, the demographic groups most similar to Immigrants from Italy are Greek (12.3%, a difference of 0.16%), Estonian (12.3%, a difference of 0.22%), Immigrants from Ukraine (12.3%, a difference of 0.23%), Immigrants from Sweden (12.3%, a difference of 0.27%), and Immigrants from Vietnam (12.3%, a difference of 0.30%).
| Demographics | Rating | Rank | Female Poverty Among 25-34 Year Olds |
| Immigrants | Belgium | 99.1 /100 | #70 | Exceptional 12.2% |
| Immigrants | Scotland | 99.1 /100 | #71 | Exceptional 12.2% |
| Lithuanians | 99.1 /100 | #72 | Exceptional 12.2% |
| Immigrants | Vietnam | 98.9 /100 | #73 | Exceptional 12.3% |
| Immigrants | Sweden | 98.9 /100 | #74 | Exceptional 12.3% |
| Estonians | 98.9 /100 | #75 | Exceptional 12.3% |
| Greeks | 98.9 /100 | #76 | Exceptional 12.3% |
| Immigrants | Italy | 98.8 /100 | #77 | Exceptional 12.3% |
| Immigrants | Ukraine | 98.6 /100 | #78 | Exceptional 12.3% |
| Immigrants | Jordan | 98.5 /100 | #79 | Exceptional 12.4% |
| Immigrants | Malaysia | 98.3 /100 | #80 | Exceptional 12.4% |
| Immigrants | Kazakhstan | 98.1 /100 | #81 | Exceptional 12.4% |
| Ethiopians | 98.0 /100 | #82 | Exceptional 12.4% |
| Albanians | 97.7 /100 | #83 | Exceptional 12.5% |
| Immigrants | Latvia | 97.7 /100 | #84 | Exceptional 12.5% |