Slavic vs Yaqui Female Poverty Among 25-34 Year Olds
COMPARE
Slavic
Yaqui
Female Poverty Among 25-34 Year Olds
Female Poverty Among 25-34 Year Olds Comparison
Slavs
Yaqui
13.2%
FEMALE POVERTY AMONG 25-34 YEAR OLDS
75.7/ 100
METRIC RATING
152nd/ 347
METRIC RANK
17.0%
FEMALE POVERTY AMONG 25-34 YEAR OLDS
0.0/ 100
METRIC RATING
307th/ 347
METRIC RANK
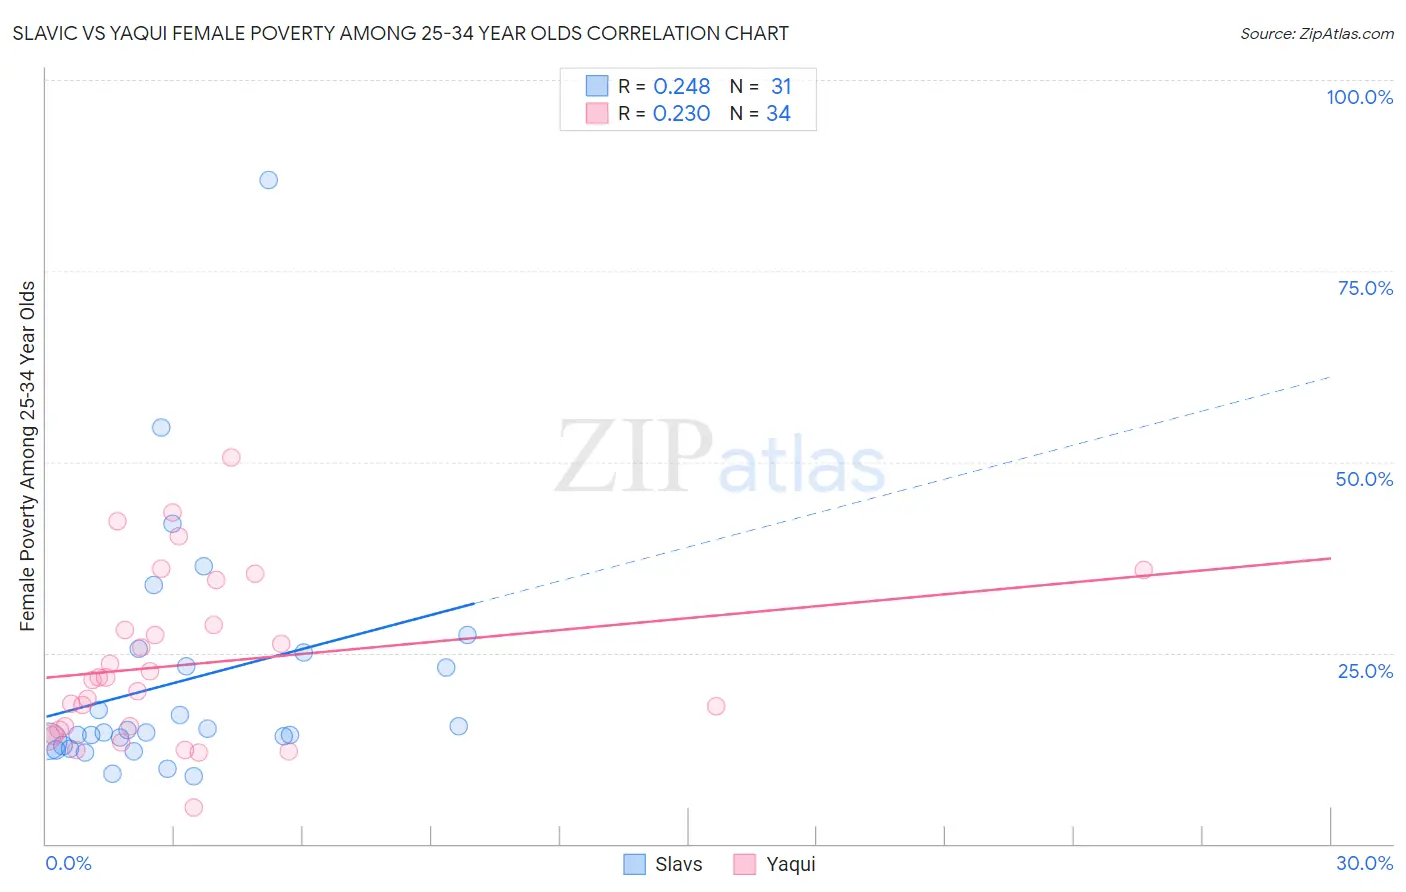
Slavic vs Yaqui Female Poverty Among 25-34 Year Olds Correlation Chart
The statistical analysis conducted on geographies consisting of 266,820,007 people shows a weak positive correlation between the proportion of Slavs and poverty level among females between the ages 25 and 34 in the United States with a correlation coefficient (R) of 0.248 and weighted average of 13.2%. Similarly, the statistical analysis conducted on geographies consisting of 107,367,613 people shows a weak positive correlation between the proportion of Yaqui and poverty level among females between the ages 25 and 34 in the United States with a correlation coefficient (R) of 0.230 and weighted average of 17.0%, a difference of 28.8%.
Female Poverty Among 25-34 Year Olds Correlation Summary
| Measurement | Slavic | Yaqui |
| Minimum | 8.9% | 4.8% |
| Maximum | 87.0% | 50.6% |
| Range | 78.1% | 45.9% |
| Mean | 21.3% | 23.5% |
| Median | 14.5% | 21.5% |
| Interquartile 25% (IQ1) | 12.9% | 14.9% |
| Interquartile 75% (IQ3) | 25.0% | 28.7% |
| Interquartile Range (IQR) | 12.1% | 13.8% |
| Standard Deviation (Sample) | 16.0% | 10.9% |
| Standard Deviation (Population) | 15.8% | 10.7% |
Similar Demographics by Female Poverty Among 25-34 Year Olds
Demographics Similar to Slavs by Female Poverty Among 25-34 Year Olds
In terms of female poverty among 25-34 year olds, the demographic groups most similar to Slavs are Costa Rican (13.2%, a difference of 0.010%), Iraqi (13.2%, a difference of 0.040%), Sierra Leonean (13.2%, a difference of 0.060%), European (13.2%, a difference of 0.13%), and Lebanese (13.2%, a difference of 0.13%).
| Demographics | Rating | Rank | Female Poverty Among 25-34 Year Olds |
| Colombians | 77.2 /100 | #145 | Good 13.2% |
| South Americans | 76.9 /100 | #146 | Good 13.2% |
| Europeans | 76.8 /100 | #147 | Good 13.2% |
| Lebanese | 76.8 /100 | #148 | Good 13.2% |
| Sierra Leoneans | 76.3 /100 | #149 | Good 13.2% |
| Iraqis | 76.0 /100 | #150 | Good 13.2% |
| Costa Ricans | 75.8 /100 | #151 | Good 13.2% |
| Slavs | 75.7 /100 | #152 | Good 13.2% |
| Northern Europeans | 73.7 /100 | #153 | Good 13.2% |
| Arabs | 73.5 /100 | #154 | Good 13.2% |
| Immigrants | Sierra Leone | 72.9 /100 | #155 | Good 13.3% |
| Immigrants | Cameroon | 72.0 /100 | #156 | Good 13.3% |
| Immigrants | Western Europe | 70.3 /100 | #157 | Good 13.3% |
| Immigrants | Colombia | 69.2 /100 | #158 | Good 13.3% |
| Uruguayans | 66.9 /100 | #159 | Good 13.3% |
Demographics Similar to Yaqui by Female Poverty Among 25-34 Year Olds
In terms of female poverty among 25-34 year olds, the demographic groups most similar to Yaqui are Chickasaw (17.0%, a difference of 0.020%), African (17.0%, a difference of 0.20%), Ottawa (17.1%, a difference of 0.50%), Immigrants from Cabo Verde (16.9%, a difference of 0.60%), and Honduran (16.9%, a difference of 0.76%).
| Demographics | Rating | Rank | Female Poverty Among 25-34 Year Olds |
| U.S. Virgin Islanders | 0.0 /100 | #300 | Tragic 16.7% |
| Immigrants | Congo | 0.0 /100 | #301 | Tragic 16.7% |
| Alaska Natives | 0.0 /100 | #302 | Tragic 16.8% |
| Immigrants | Mexico | 0.0 /100 | #303 | Tragic 16.8% |
| Hondurans | 0.0 /100 | #304 | Tragic 16.9% |
| Immigrants | Cabo Verde | 0.0 /100 | #305 | Tragic 16.9% |
| Chickasaw | 0.0 /100 | #306 | Tragic 17.0% |
| Yaqui | 0.0 /100 | #307 | Tragic 17.0% |
| Africans | 0.0 /100 | #308 | Tragic 17.0% |
| Ottawa | 0.0 /100 | #309 | Tragic 17.1% |
| Cherokee | 0.0 /100 | #310 | Tragic 17.2% |
| Immigrants | Honduras | 0.0 /100 | #311 | Tragic 17.3% |
| Iroquois | 0.0 /100 | #312 | Tragic 17.5% |
| Colville | 0.0 /100 | #313 | Tragic 17.5% |
| Immigrants | Dominican Republic | 0.0 /100 | #314 | Tragic 17.6% |