Hmong vs Basque Single Female Poverty
COMPARE
Hmong
Basque
Single Female Poverty
Single Female Poverty Comparison
Hmong
Basques
23.1%
SINGLE FEMALE POVERTY
0.2/ 100
METRIC RATING
269th/ 347
METRIC RANK
21.3%
SINGLE FEMALE POVERTY
28.1/ 100
METRIC RATING
193rd/ 347
METRIC RANK
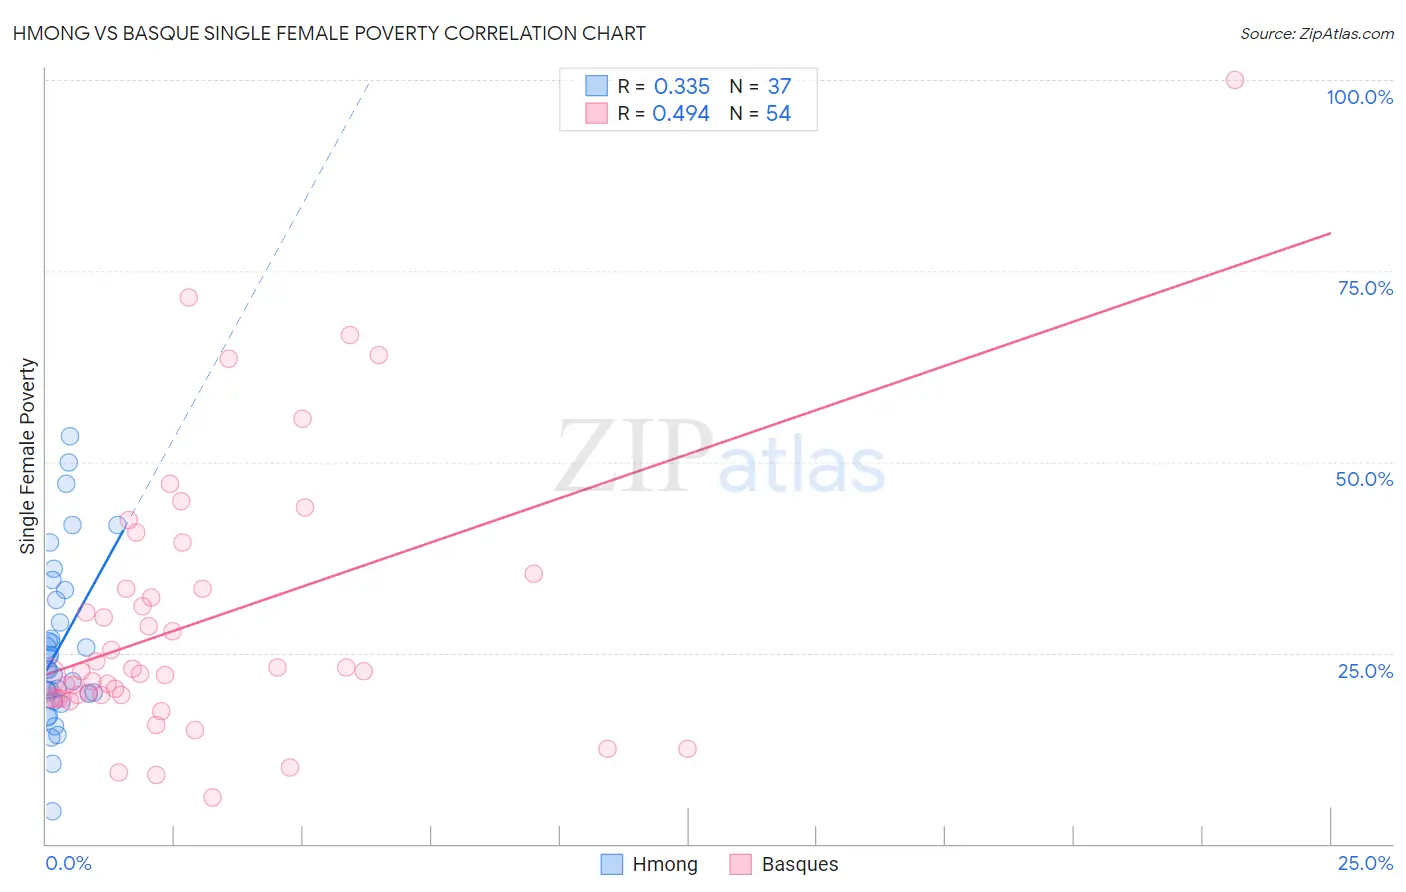
Hmong vs Basque Single Female Poverty Correlation Chart
The statistical analysis conducted on geographies consisting of 24,642,418 people shows a mild positive correlation between the proportion of Hmong and poverty level among single females in the United States with a correlation coefficient (R) of 0.335 and weighted average of 23.1%. Similarly, the statistical analysis conducted on geographies consisting of 164,728,632 people shows a moderate positive correlation between the proportion of Basques and poverty level among single females in the United States with a correlation coefficient (R) of 0.494 and weighted average of 21.3%, a difference of 8.2%.
Single Female Poverty Correlation Summary
| Measurement | Hmong | Basque |
| Minimum | 4.3% | 6.1% |
| Maximum | 53.4% | 100.0% |
| Range | 49.1% | 93.9% |
| Mean | 25.8% | 29.2% |
| Median | 22.9% | 22.6% |
| Interquartile 25% (IQ1) | 19.1% | 19.2% |
| Interquartile 75% (IQ3) | 32.5% | 33.4% |
| Interquartile Range (IQR) | 13.4% | 14.2% |
| Standard Deviation (Sample) | 11.0% | 17.9% |
| Standard Deviation (Population) | 10.9% | 17.8% |
Similar Demographics by Single Female Poverty
Demographics Similar to Hmong by Single Female Poverty
In terms of single female poverty, the demographic groups most similar to Hmong are Fijian (23.1%, a difference of 0.030%), Senegalese (23.0%, a difference of 0.10%), Immigrants from Micronesia (23.0%, a difference of 0.16%), Inupiat (23.1%, a difference of 0.26%), and Central American (23.0%, a difference of 0.37%).
| Demographics | Rating | Rank | Single Female Poverty |
| British West Indians | 0.4 /100 | #262 | Tragic 22.8% |
| Scotch-Irish | 0.3 /100 | #263 | Tragic 22.9% |
| Immigrants | Laos | 0.3 /100 | #264 | Tragic 22.9% |
| Central Americans | 0.2 /100 | #265 | Tragic 23.0% |
| Immigrants | Micronesia | 0.2 /100 | #266 | Tragic 23.0% |
| Senegalese | 0.2 /100 | #267 | Tragic 23.0% |
| Fijians | 0.2 /100 | #268 | Tragic 23.1% |
| Hmong | 0.2 /100 | #269 | Tragic 23.1% |
| Inupiat | 0.2 /100 | #270 | Tragic 23.1% |
| Sub-Saharan Africans | 0.1 /100 | #271 | Tragic 23.2% |
| Immigrants | Senegal | 0.1 /100 | #272 | Tragic 23.2% |
| Alaska Natives | 0.1 /100 | #273 | Tragic 23.3% |
| Marshallese | 0.1 /100 | #274 | Tragic 23.3% |
| Mexican American Indians | 0.1 /100 | #275 | Tragic 23.4% |
| Immigrants | Azores | 0.0 /100 | #276 | Tragic 23.5% |
Demographics Similar to Basques by Single Female Poverty
In terms of single female poverty, the demographic groups most similar to Basques are Czechoslovakian (21.3%, a difference of 0.030%), Nicaraguan (21.3%, a difference of 0.040%), Immigrants from Saudi Arabia (21.3%, a difference of 0.070%), Japanese (21.3%, a difference of 0.13%), and Immigrants from Jamaica (21.3%, a difference of 0.18%).
| Demographics | Rating | Rank | Single Female Poverty |
| Hawaiians | 37.7 /100 | #186 | Fair 21.2% |
| Immigrants | Nigeria | 36.8 /100 | #187 | Fair 21.2% |
| Yugoslavians | 35.4 /100 | #188 | Fair 21.2% |
| Immigrants | Cuba | 35.3 /100 | #189 | Fair 21.2% |
| Trinidadians and Tobagonians | 35.2 /100 | #190 | Fair 21.2% |
| Immigrants | Germany | 31.1 /100 | #191 | Fair 21.3% |
| Immigrants | Jamaica | 30.5 /100 | #192 | Fair 21.3% |
| Basques | 28.1 /100 | #193 | Fair 21.3% |
| Czechoslovakians | 27.7 /100 | #194 | Fair 21.3% |
| Nicaraguans | 27.6 /100 | #195 | Fair 21.3% |
| Immigrants | Saudi Arabia | 27.1 /100 | #196 | Fair 21.3% |
| Japanese | 26.4 /100 | #197 | Fair 21.3% |
| Swiss | 24.2 /100 | #198 | Fair 21.4% |
| Immigrants | Immigrants | 22.0 /100 | #199 | Fair 21.4% |
| Irish | 21.4 /100 | #200 | Fair 21.4% |