Hispanic or Latino vs Lebanese Male Poverty
COMPARE
Hispanic or Latino
Lebanese
Male Poverty
Male Poverty Comparison
Hispanics or Latinos
Lebanese
13.9%
MALE POVERTY
0.0/ 100
METRIC RATING
294th/ 347
METRIC RANK
11.2%
MALE POVERTY
45.6/ 100
METRIC RATING
177th/ 347
METRIC RANK
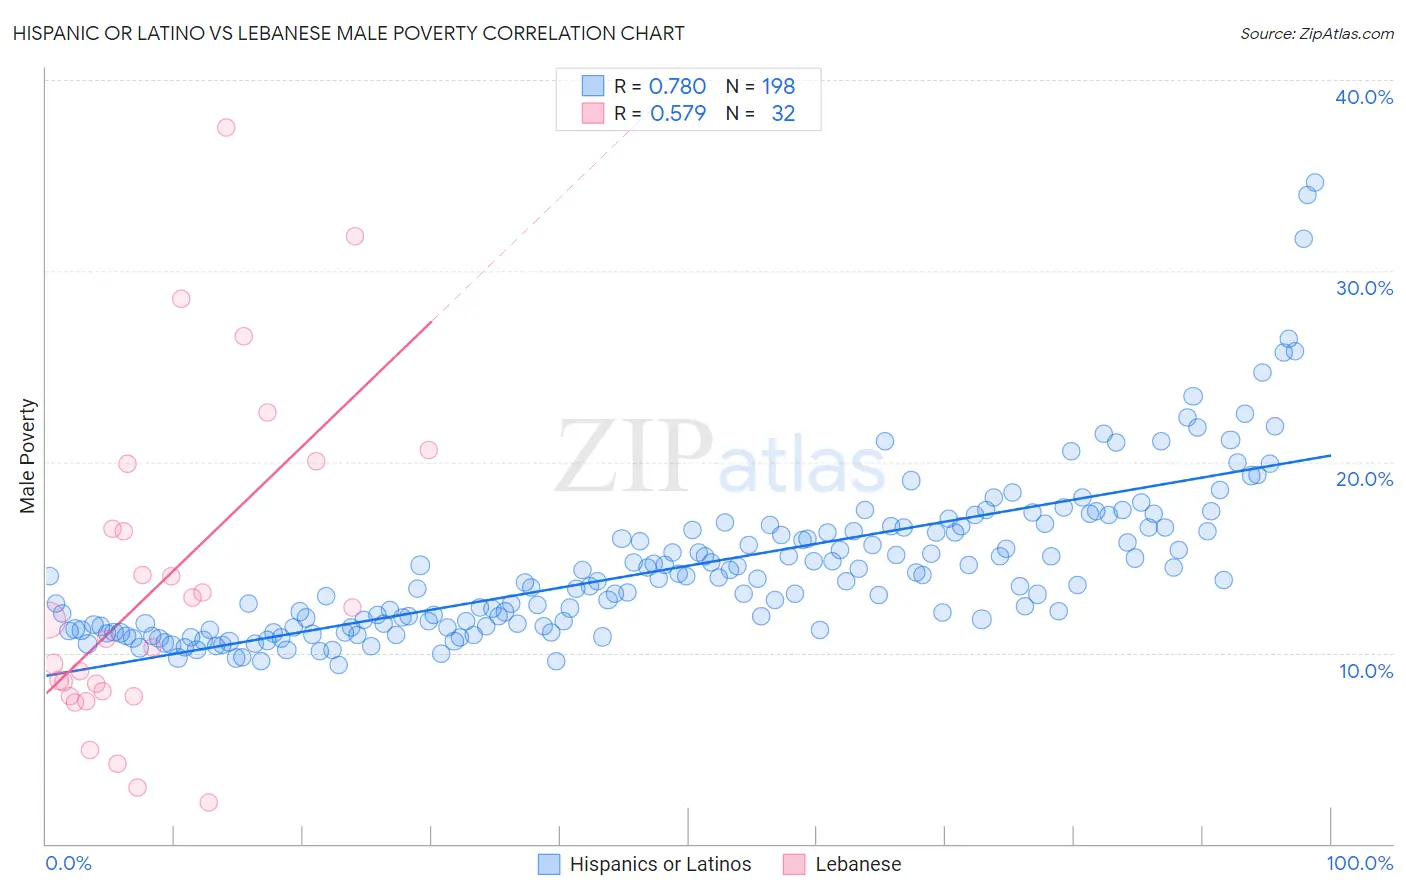
Hispanic or Latino vs Lebanese Male Poverty Correlation Chart
The statistical analysis conducted on geographies consisting of 573,631,780 people shows a strong positive correlation between the proportion of Hispanics or Latinos and poverty level among males in the United States with a correlation coefficient (R) of 0.780 and weighted average of 13.9%. Similarly, the statistical analysis conducted on geographies consisting of 401,187,213 people shows a substantial positive correlation between the proportion of Lebanese and poverty level among males in the United States with a correlation coefficient (R) of 0.579 and weighted average of 11.2%, a difference of 23.3%.
Male Poverty Correlation Summary
| Measurement | Hispanic or Latino | Lebanese |
| Minimum | 9.3% | 2.1% |
| Maximum | 34.6% | 37.5% |
| Range | 25.3% | 35.4% |
| Mean | 14.5% | 13.6% |
| Median | 13.7% | 11.2% |
| Interquartile 25% (IQ1) | 11.3% | 7.9% |
| Interquartile 75% (IQ3) | 16.4% | 18.2% |
| Interquartile Range (IQR) | 5.1% | 10.3% |
| Standard Deviation (Sample) | 4.2% | 8.5% |
| Standard Deviation (Population) | 4.2% | 8.4% |
Similar Demographics by Male Poverty
Demographics Similar to Hispanics or Latinos by Male Poverty
In terms of male poverty, the demographic groups most similar to Hispanics or Latinos are Immigrants from Belize (13.8%, a difference of 0.060%), Indonesian (13.8%, a difference of 0.070%), Vietnamese (13.8%, a difference of 0.24%), Immigrants from Central America (13.9%, a difference of 0.28%), and Immigrants from Zaire (13.8%, a difference of 0.32%).
| Demographics | Rating | Rank | Male Poverty |
| Immigrants | Barbados | 0.0 /100 | #287 | Tragic 13.8% |
| Immigrants | St. Vincent and the Grenadines | 0.0 /100 | #288 | Tragic 13.8% |
| Guatemalans | 0.0 /100 | #289 | Tragic 13.8% |
| Immigrants | Zaire | 0.0 /100 | #290 | Tragic 13.8% |
| Vietnamese | 0.0 /100 | #291 | Tragic 13.8% |
| Indonesians | 0.0 /100 | #292 | Tragic 13.8% |
| Immigrants | Belize | 0.0 /100 | #293 | Tragic 13.8% |
| Hispanics or Latinos | 0.0 /100 | #294 | Tragic 13.9% |
| Immigrants | Central America | 0.0 /100 | #295 | Tragic 13.9% |
| Cajuns | 0.0 /100 | #296 | Tragic 13.9% |
| Inupiat | 0.0 /100 | #297 | Tragic 14.0% |
| Blackfeet | 0.0 /100 | #298 | Tragic 14.0% |
| Immigrants | Guatemala | 0.0 /100 | #299 | Tragic 14.0% |
| Immigrants | Mexico | 0.0 /100 | #300 | Tragic 14.0% |
| Immigrants | Senegal | 0.0 /100 | #301 | Tragic 14.0% |
Demographics Similar to Lebanese by Male Poverty
In terms of male poverty, the demographic groups most similar to Lebanese are Immigrants from Fiji (11.2%, a difference of 0.040%), Immigrants from Cameroon (11.2%, a difference of 0.11%), Celtic (11.2%, a difference of 0.18%), Immigrants from Oceania (11.2%, a difference of 0.43%), and Pennsylvania German (11.2%, a difference of 0.47%).
| Demographics | Rating | Rank | Male Poverty |
| South Americans | 53.8 /100 | #170 | Average 11.1% |
| Uruguayans | 51.0 /100 | #171 | Average 11.2% |
| Immigrants | Ethiopia | 50.7 /100 | #172 | Average 11.2% |
| Pennsylvania Germans | 50.5 /100 | #173 | Average 11.2% |
| Immigrants | Oceania | 50.0 /100 | #174 | Average 11.2% |
| Celtics | 47.5 /100 | #175 | Average 11.2% |
| Immigrants | Fiji | 46.0 /100 | #176 | Average 11.2% |
| Lebanese | 45.6 /100 | #177 | Average 11.2% |
| Immigrants | Cameroon | 44.5 /100 | #178 | Average 11.2% |
| Immigrants | Syria | 40.3 /100 | #179 | Average 11.3% |
| Immigrants | Morocco | 40.1 /100 | #180 | Average 11.3% |
| Immigrants | Costa Rica | 39.5 /100 | #181 | Fair 11.3% |
| Mongolians | 39.0 /100 | #182 | Fair 11.3% |
| Kenyans | 38.4 /100 | #183 | Fair 11.3% |
| Immigrants | South America | 36.9 /100 | #184 | Fair 11.3% |