Hispanic or Latino vs Honduran Male Poverty
COMPARE
Hispanic or Latino
Honduran
Male Poverty
Male Poverty Comparison
Hispanics or Latinos
Hondurans
13.9%
MALE POVERTY
0.0/ 100
METRIC RATING
294th/ 347
METRIC RANK
14.3%
MALE POVERTY
0.0/ 100
METRIC RATING
311th/ 347
METRIC RANK
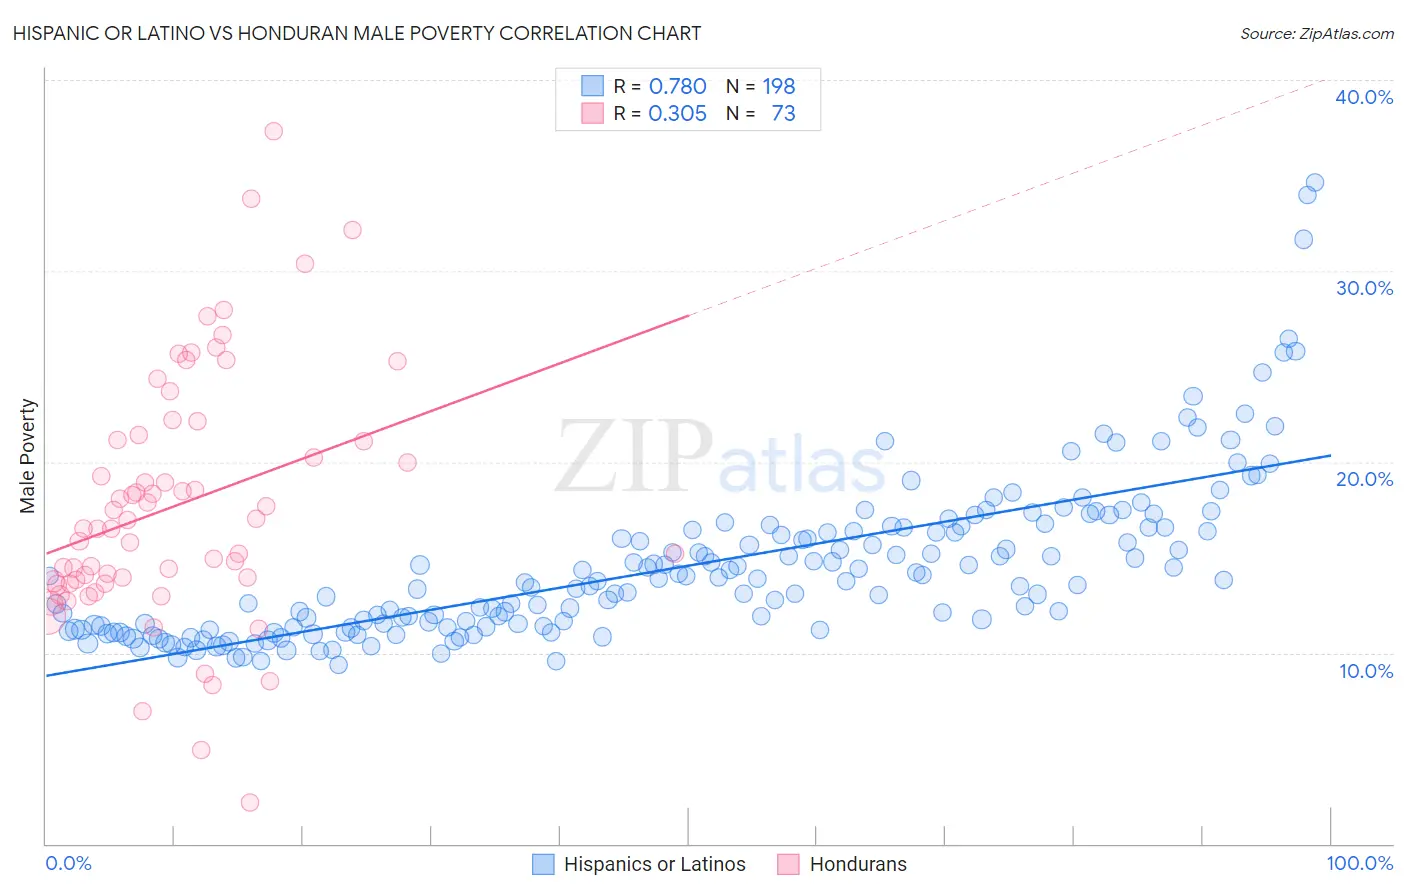
Hispanic or Latino vs Honduran Male Poverty Correlation Chart
The statistical analysis conducted on geographies consisting of 573,631,780 people shows a strong positive correlation between the proportion of Hispanics or Latinos and poverty level among males in the United States with a correlation coefficient (R) of 0.780 and weighted average of 13.9%. Similarly, the statistical analysis conducted on geographies consisting of 357,543,149 people shows a mild positive correlation between the proportion of Hondurans and poverty level among males in the United States with a correlation coefficient (R) of 0.305 and weighted average of 14.3%, a difference of 3.4%.
Male Poverty Correlation Summary
| Measurement | Hispanic or Latino | Honduran |
| Minimum | 9.3% | 2.2% |
| Maximum | 34.6% | 37.3% |
| Range | 25.3% | 35.2% |
| Mean | 14.5% | 17.7% |
| Median | 13.7% | 16.5% |
| Interquartile 25% (IQ1) | 11.3% | 13.7% |
| Interquartile 75% (IQ3) | 16.4% | 21.3% |
| Interquartile Range (IQR) | 5.1% | 7.6% |
| Standard Deviation (Sample) | 4.2% | 6.5% |
| Standard Deviation (Population) | 4.2% | 6.5% |
Demographics Similar to Hispanics or Latinos and Hondurans by Male Poverty
In terms of male poverty, the demographic groups most similar to Hispanics or Latinos are Immigrants from Belize (13.8%, a difference of 0.060%), Indonesian (13.8%, a difference of 0.070%), Immigrants from Central America (13.9%, a difference of 0.28%), Cajun (13.9%, a difference of 0.40%), and Inupiat (14.0%, a difference of 1.0%). Similarly, the demographic groups most similar to Hondurans are Seminole (14.3%, a difference of 0.21%), Somali (14.3%, a difference of 0.41%), Choctaw (14.4%, a difference of 0.47%), African (14.2%, a difference of 0.79%), and Dutch West Indian (14.2%, a difference of 0.81%).
| Demographics | Rating | Rank | Male Poverty |
| Indonesians | 0.0 /100 | #292 | Tragic 13.8% |
| Immigrants | Belize | 0.0 /100 | #293 | Tragic 13.8% |
| Hispanics or Latinos | 0.0 /100 | #294 | Tragic 13.9% |
| Immigrants | Central America | 0.0 /100 | #295 | Tragic 13.9% |
| Cajuns | 0.0 /100 | #296 | Tragic 13.9% |
| Inupiat | 0.0 /100 | #297 | Tragic 14.0% |
| Blackfeet | 0.0 /100 | #298 | Tragic 14.0% |
| Immigrants | Guatemala | 0.0 /100 | #299 | Tragic 14.0% |
| Immigrants | Mexico | 0.0 /100 | #300 | Tragic 14.0% |
| Immigrants | Senegal | 0.0 /100 | #301 | Tragic 14.0% |
| Immigrants | Caribbean | 0.0 /100 | #302 | Tragic 14.0% |
| Bahamians | 0.0 /100 | #303 | Tragic 14.1% |
| Senegalese | 0.0 /100 | #304 | Tragic 14.1% |
| Immigrants | Bangladesh | 0.0 /100 | #305 | Tragic 14.1% |
| Creek | 0.0 /100 | #306 | Tragic 14.1% |
| Dutch West Indians | 0.0 /100 | #307 | Tragic 14.2% |
| Africans | 0.0 /100 | #308 | Tragic 14.2% |
| Somalis | 0.0 /100 | #309 | Tragic 14.3% |
| Seminole | 0.0 /100 | #310 | Tragic 14.3% |
| Hondurans | 0.0 /100 | #311 | Tragic 14.3% |
| Choctaw | 0.0 /100 | #312 | Tragic 14.4% |