Hispanic or Latino vs Immigrants from Malaysia Male Poverty
COMPARE
Hispanic or Latino
Immigrants from Malaysia
Male Poverty
Male Poverty Comparison
Hispanics or Latinos
Immigrants from Malaysia
13.9%
MALE POVERTY
0.0/ 100
METRIC RATING
294th/ 347
METRIC RANK
11.0%
MALE POVERTY
64.7/ 100
METRIC RATING
155th/ 347
METRIC RANK
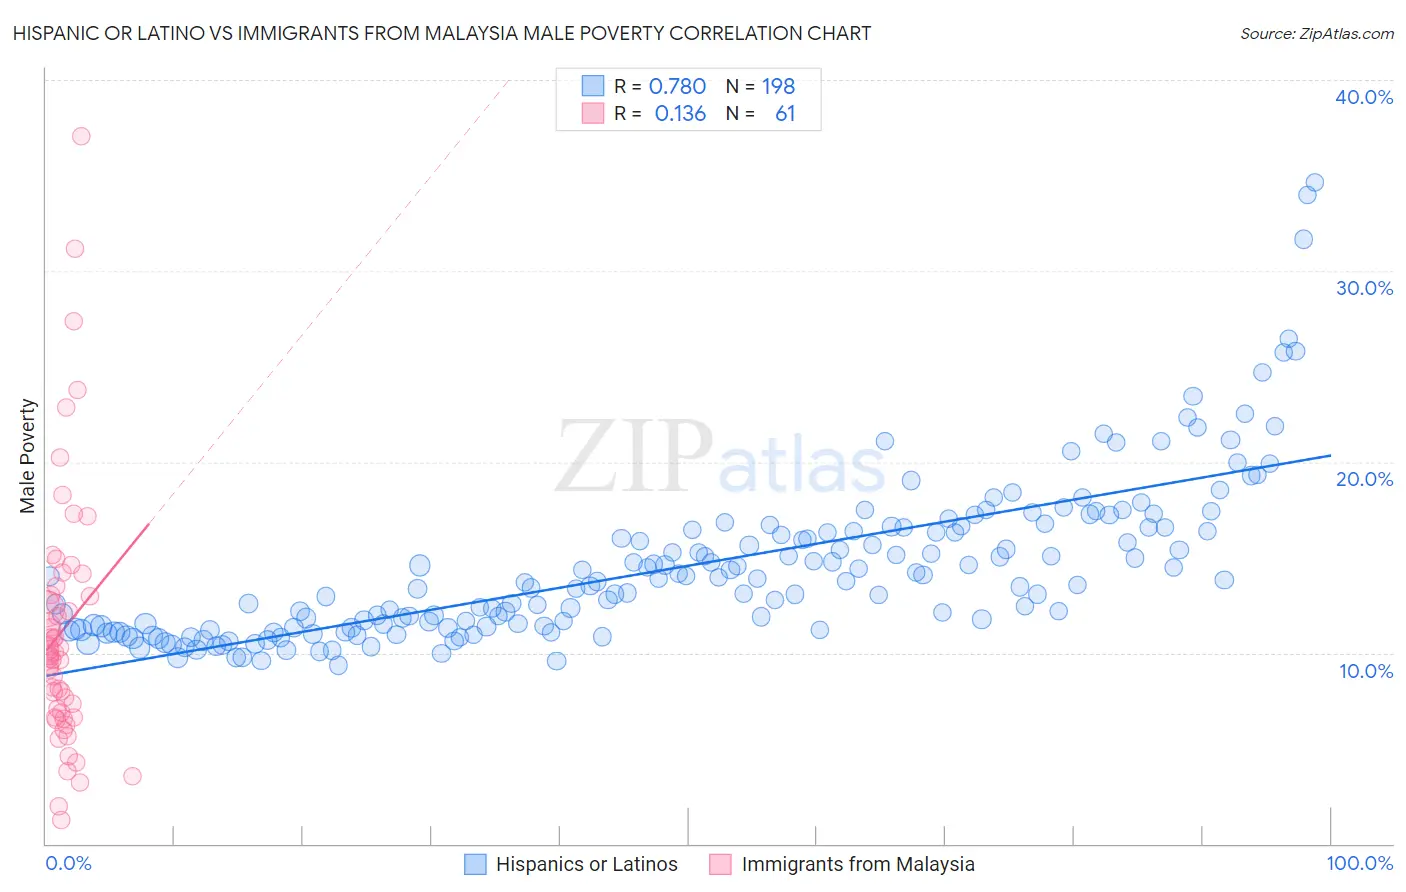
Hispanic or Latino vs Immigrants from Malaysia Male Poverty Correlation Chart
The statistical analysis conducted on geographies consisting of 573,631,780 people shows a strong positive correlation between the proportion of Hispanics or Latinos and poverty level among males in the United States with a correlation coefficient (R) of 0.780 and weighted average of 13.9%. Similarly, the statistical analysis conducted on geographies consisting of 197,921,131 people shows a poor positive correlation between the proportion of Immigrants from Malaysia and poverty level among males in the United States with a correlation coefficient (R) of 0.136 and weighted average of 11.0%, a difference of 25.7%.
Male Poverty Correlation Summary
| Measurement | Hispanic or Latino | Immigrants from Malaysia |
| Minimum | 9.3% | 1.3% |
| Maximum | 34.6% | 37.1% |
| Range | 25.3% | 35.8% |
| Mean | 14.5% | 11.2% |
| Median | 13.7% | 9.9% |
| Interquartile 25% (IQ1) | 11.3% | 6.8% |
| Interquartile 75% (IQ3) | 16.4% | 13.2% |
| Interquartile Range (IQR) | 5.1% | 6.5% |
| Standard Deviation (Sample) | 4.2% | 6.7% |
| Standard Deviation (Population) | 4.2% | 6.6% |
Similar Demographics by Male Poverty
Demographics Similar to Hispanics or Latinos by Male Poverty
In terms of male poverty, the demographic groups most similar to Hispanics or Latinos are Immigrants from Belize (13.8%, a difference of 0.060%), Indonesian (13.8%, a difference of 0.070%), Vietnamese (13.8%, a difference of 0.24%), Immigrants from Central America (13.9%, a difference of 0.28%), and Immigrants from Zaire (13.8%, a difference of 0.32%).
| Demographics | Rating | Rank | Male Poverty |
| Immigrants | Barbados | 0.0 /100 | #287 | Tragic 13.8% |
| Immigrants | St. Vincent and the Grenadines | 0.0 /100 | #288 | Tragic 13.8% |
| Guatemalans | 0.0 /100 | #289 | Tragic 13.8% |
| Immigrants | Zaire | 0.0 /100 | #290 | Tragic 13.8% |
| Vietnamese | 0.0 /100 | #291 | Tragic 13.8% |
| Indonesians | 0.0 /100 | #292 | Tragic 13.8% |
| Immigrants | Belize | 0.0 /100 | #293 | Tragic 13.8% |
| Hispanics or Latinos | 0.0 /100 | #294 | Tragic 13.9% |
| Immigrants | Central America | 0.0 /100 | #295 | Tragic 13.9% |
| Cajuns | 0.0 /100 | #296 | Tragic 13.9% |
| Inupiat | 0.0 /100 | #297 | Tragic 14.0% |
| Blackfeet | 0.0 /100 | #298 | Tragic 14.0% |
| Immigrants | Guatemala | 0.0 /100 | #299 | Tragic 14.0% |
| Immigrants | Mexico | 0.0 /100 | #300 | Tragic 14.0% |
| Immigrants | Senegal | 0.0 /100 | #301 | Tragic 14.0% |
Demographics Similar to Immigrants from Malaysia by Male Poverty
In terms of male poverty, the demographic groups most similar to Immigrants from Malaysia are Immigrants from Kazakhstan (11.0%, a difference of 0.010%), Immigrants from Bosnia and Herzegovina (11.0%, a difference of 0.050%), Costa Rican (11.0%, a difference of 0.090%), Scotch-Irish (11.0%, a difference of 0.11%), and Colombian (11.0%, a difference of 0.19%).
| Demographics | Rating | Rank | Male Poverty |
| Armenians | 68.0 /100 | #148 | Good 11.0% |
| Immigrants | Venezuela | 67.9 /100 | #149 | Good 11.0% |
| Guamanians/Chamorros | 67.6 /100 | #150 | Good 11.0% |
| Venezuelans | 67.4 /100 | #151 | Good 11.0% |
| Immigrants | Nepal | 67.3 /100 | #152 | Good 11.0% |
| Immigrants | Bosnia and Herzegovina | 65.2 /100 | #153 | Good 11.0% |
| Immigrants | Kazakhstan | 64.8 /100 | #154 | Good 11.0% |
| Immigrants | Malaysia | 64.7 /100 | #155 | Good 11.0% |
| Costa Ricans | 63.9 /100 | #156 | Good 11.0% |
| Scotch-Irish | 63.7 /100 | #157 | Good 11.0% |
| Colombians | 63.0 /100 | #158 | Good 11.0% |
| Taiwanese | 62.7 /100 | #159 | Good 11.0% |
| Soviet Union | 60.3 /100 | #160 | Good 11.1% |
| Immigrants | Northern Africa | 59.7 /100 | #161 | Average 11.1% |
| Immigrants | Chile | 57.4 /100 | #162 | Average 11.1% |