Hispanic or Latino vs Norwegian Births to Unmarried Women
COMPARE
Hispanic or Latino
Norwegian
Births to Unmarried Women
Births to Unmarried Women Comparison
Hispanics or Latinos
Norwegians
37.8%
BIRTHS TO UNMARRIED WOMEN
0.0/ 100
METRIC RATING
290th/ 347
METRIC RANK
29.3%
BIRTHS TO UNMARRIED WOMEN
95.8/ 100
METRIC RATING
96th/ 347
METRIC RANK
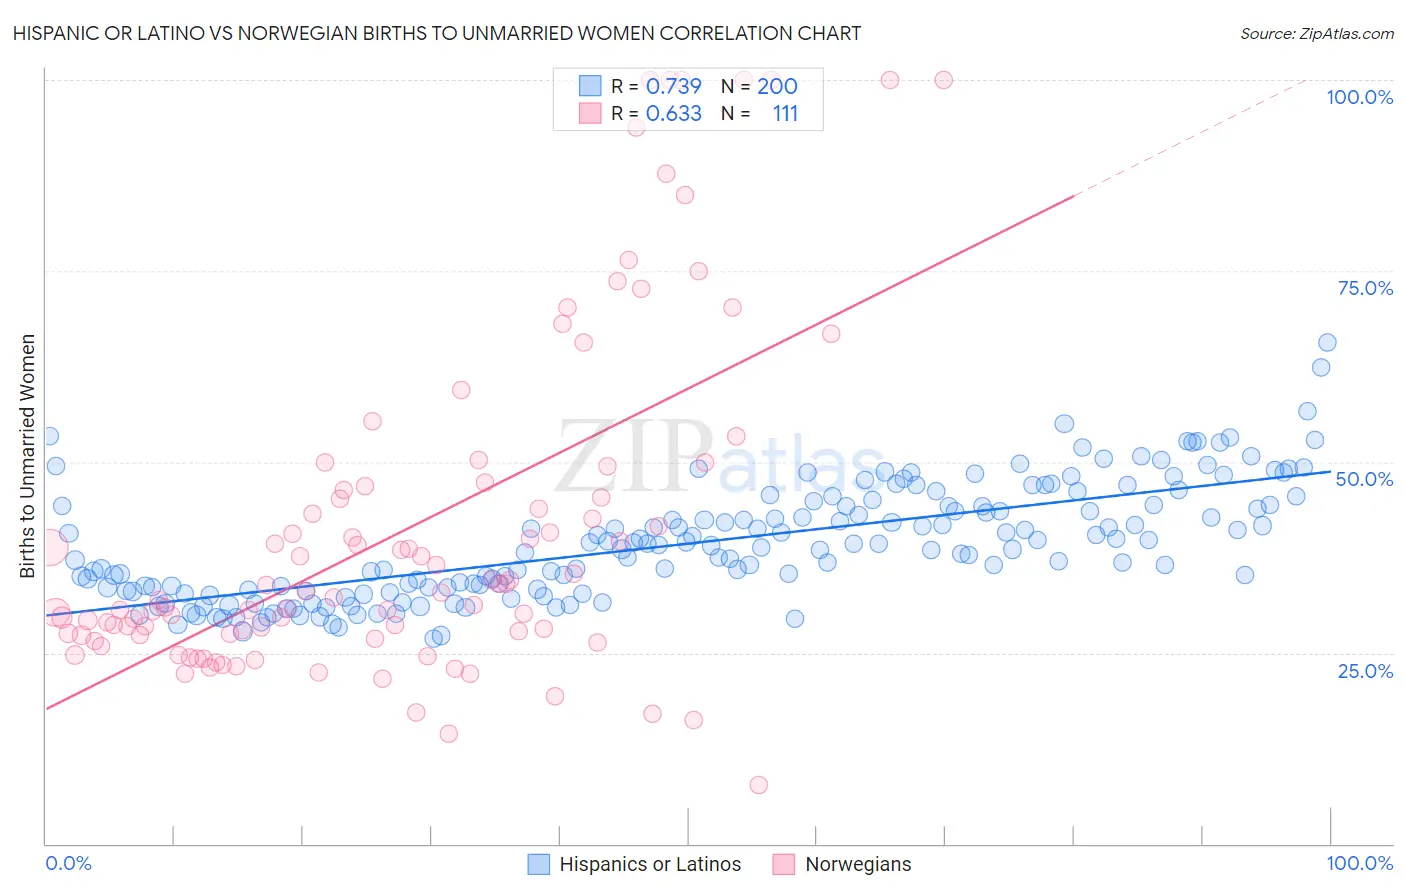
Hispanic or Latino vs Norwegian Births to Unmarried Women Correlation Chart
The statistical analysis conducted on geographies consisting of 511,497,668 people shows a strong positive correlation between the proportion of Hispanics or Latinos and percentage of births to unmarried women in the United States with a correlation coefficient (R) of 0.739 and weighted average of 37.8%. Similarly, the statistical analysis conducted on geographies consisting of 477,355,885 people shows a significant positive correlation between the proportion of Norwegians and percentage of births to unmarried women in the United States with a correlation coefficient (R) of 0.633 and weighted average of 29.3%, a difference of 28.7%.
Births to Unmarried Women Correlation Summary
| Measurement | Hispanic or Latino | Norwegian |
| Minimum | 26.9% | 7.7% |
| Maximum | 65.6% | 100.0% |
| Range | 38.8% | 92.3% |
| Mean | 39.3% | 41.3% |
| Median | 38.7% | 32.9% |
| Interquartile 25% (IQ1) | 33.3% | 27.3% |
| Interquartile 75% (IQ3) | 44.3% | 46.7% |
| Interquartile Range (IQR) | 11.0% | 19.4% |
| Standard Deviation (Sample) | 7.4% | 22.3% |
| Standard Deviation (Population) | 7.4% | 22.2% |
Similar Demographics by Births to Unmarried Women
Demographics Similar to Hispanics or Latinos by Births to Unmarried Women
In terms of births to unmarried women, the demographic groups most similar to Hispanics or Latinos are Alaskan Athabascan (37.7%, a difference of 0.14%), Seminole (37.9%, a difference of 0.34%), Immigrants from Liberia (37.6%, a difference of 0.37%), Blackfeet (37.9%, a difference of 0.39%), and Creek (37.6%, a difference of 0.54%).
| Demographics | Rating | Rank | Births to Unmarried Women |
| Spanish American Indians | 0.0 /100 | #283 | Tragic 37.4% |
| Immigrants | Central America | 0.0 /100 | #284 | Tragic 37.4% |
| Immigrants | Mexico | 0.0 /100 | #285 | Tragic 37.5% |
| Immigrants | Guatemala | 0.0 /100 | #286 | Tragic 37.5% |
| Creek | 0.0 /100 | #287 | Tragic 37.6% |
| Immigrants | Liberia | 0.0 /100 | #288 | Tragic 37.6% |
| Alaskan Athabascans | 0.0 /100 | #289 | Tragic 37.7% |
| Hispanics or Latinos | 0.0 /100 | #290 | Tragic 37.8% |
| Seminole | 0.0 /100 | #291 | Tragic 37.9% |
| Blackfeet | 0.0 /100 | #292 | Tragic 37.9% |
| Immigrants | Nicaragua | 0.0 /100 | #293 | Tragic 38.0% |
| British West Indians | 0.0 /100 | #294 | Tragic 38.0% |
| Iroquois | 0.0 /100 | #295 | Tragic 38.2% |
| Alaska Natives | 0.0 /100 | #296 | Tragic 38.3% |
| Dutch West Indians | 0.0 /100 | #297 | Tragic 38.4% |
Demographics Similar to Norwegians by Births to Unmarried Women
In terms of births to unmarried women, the demographic groups most similar to Norwegians are Immigrants from South Africa (29.3%, a difference of 0.040%), Immigrants from Syria (29.4%, a difference of 0.070%), Immigrants from Vietnam (29.3%, a difference of 0.23%), Immigrants from Denmark (29.4%, a difference of 0.30%), and Luxembourger (29.4%, a difference of 0.30%).
| Demographics | Rating | Rank | Births to Unmarried Women |
| Immigrants | Saudi Arabia | 97.0 /100 | #89 | Exceptional 29.1% |
| Immigrants | Latvia | 96.8 /100 | #90 | Exceptional 29.1% |
| Immigrants | Fiji | 96.6 /100 | #91 | Exceptional 29.2% |
| Arabs | 96.5 /100 | #92 | Exceptional 29.2% |
| Estonians | 96.5 /100 | #93 | Exceptional 29.2% |
| Ukrainians | 96.3 /100 | #94 | Exceptional 29.2% |
| Immigrants | Vietnam | 96.1 /100 | #95 | Exceptional 29.3% |
| Norwegians | 95.8 /100 | #96 | Exceptional 29.3% |
| Immigrants | South Africa | 95.7 /100 | #97 | Exceptional 29.3% |
| Immigrants | Syria | 95.7 /100 | #98 | Exceptional 29.4% |
| Immigrants | Denmark | 95.3 /100 | #99 | Exceptional 29.4% |
| Luxembourgers | 95.2 /100 | #100 | Exceptional 29.4% |
| Immigrants | Northern Africa | 94.7 /100 | #101 | Exceptional 29.5% |
| Australians | 94.6 /100 | #102 | Exceptional 29.5% |
| Lebanese | 94.4 /100 | #103 | Exceptional 29.5% |