Haitian vs Immigrants from Northern Africa Female Poverty
COMPARE
Haitian
Immigrants from Northern Africa
Female Poverty
Female Poverty Comparison
Haitians
Immigrants from Northern Africa
15.9%
FEMALE POVERTY
0.0/ 100
METRIC RATING
273rd/ 347
METRIC RANK
13.2%
FEMALE POVERTY
68.8/ 100
METRIC RATING
157th/ 347
METRIC RANK
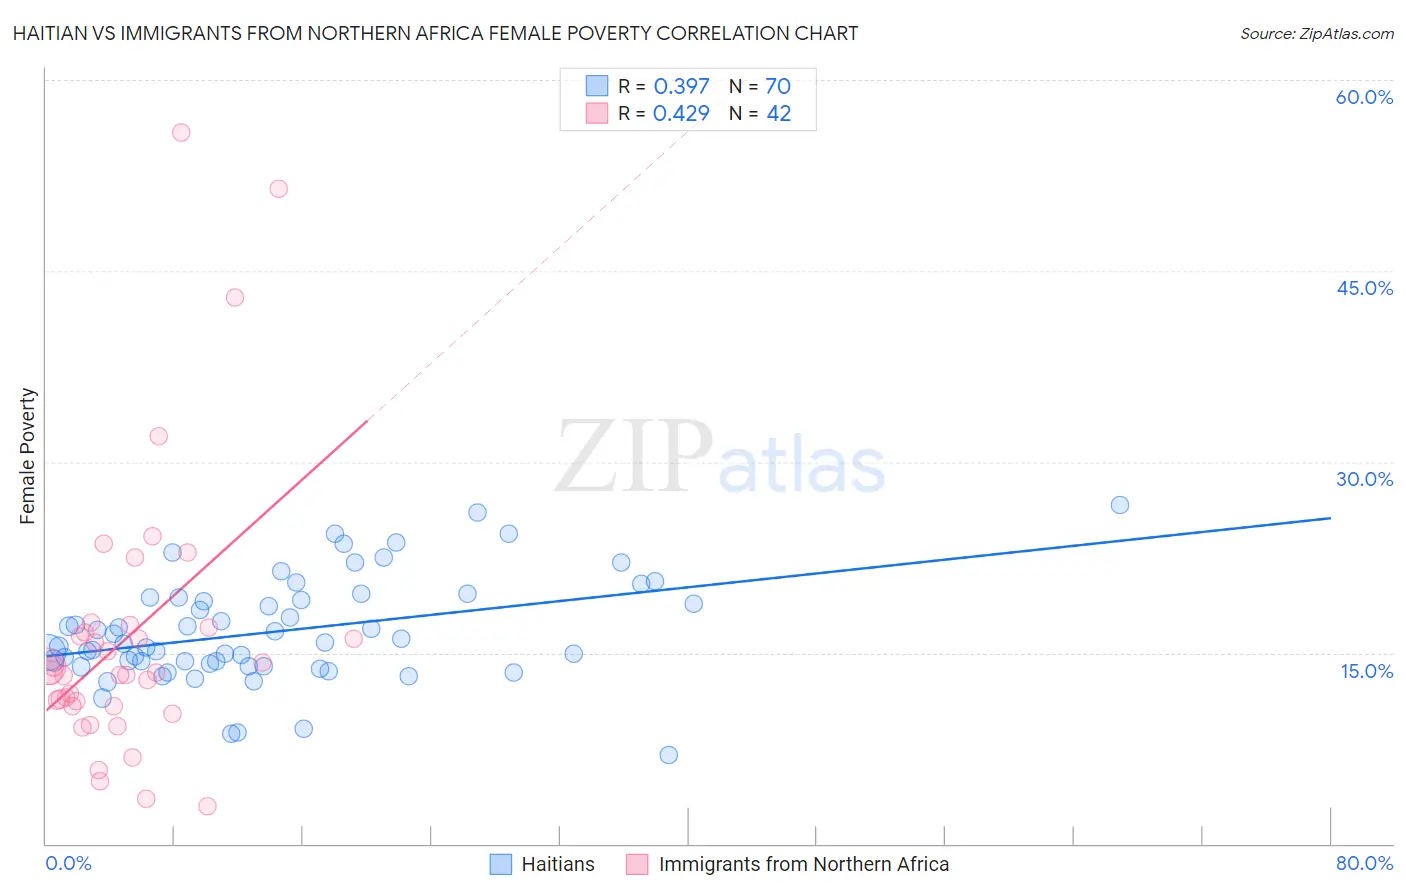
Haitian vs Immigrants from Northern Africa Female Poverty Correlation Chart
The statistical analysis conducted on geographies consisting of 287,638,574 people shows a mild positive correlation between the proportion of Haitians and poverty level among females in the United States with a correlation coefficient (R) of 0.397 and weighted average of 15.9%. Similarly, the statistical analysis conducted on geographies consisting of 321,053,699 people shows a moderate positive correlation between the proportion of Immigrants from Northern Africa and poverty level among females in the United States with a correlation coefficient (R) of 0.429 and weighted average of 13.2%, a difference of 20.9%.
Female Poverty Correlation Summary
| Measurement | Haitian | Immigrants from Northern Africa |
| Minimum | 6.9% | 3.0% |
| Maximum | 26.6% | 55.9% |
| Range | 19.6% | 52.9% |
| Mean | 16.7% | 16.3% |
| Median | 15.8% | 13.5% |
| Interquartile 25% (IQ1) | 14.1% | 10.8% |
| Interquartile 75% (IQ3) | 19.3% | 17.0% |
| Interquartile Range (IQR) | 5.2% | 6.2% |
| Standard Deviation (Sample) | 4.1% | 11.1% |
| Standard Deviation (Population) | 4.1% | 11.0% |
Similar Demographics by Female Poverty
Demographics Similar to Haitians by Female Poverty
In terms of female poverty, the demographic groups most similar to Haitians are Belizean (15.9%, a difference of 0.0%), Barbadian (15.9%, a difference of 0.0%), Immigrants from Barbados (16.0%, a difference of 0.070%), Central American (16.0%, a difference of 0.20%), and Immigrants from St. Vincent and the Grenadines (15.9%, a difference of 0.23%).
| Demographics | Rating | Rank | Female Poverty |
| Immigrants | El Salvador | 0.1 /100 | #266 | Tragic 15.7% |
| Sub-Saharan Africans | 0.1 /100 | #267 | Tragic 15.8% |
| Immigrants | Nicaragua | 0.1 /100 | #268 | Tragic 15.8% |
| Iroquois | 0.1 /100 | #269 | Tragic 15.8% |
| Chickasaw | 0.1 /100 | #270 | Tragic 15.9% |
| Immigrants | St. Vincent and the Grenadines | 0.0 /100 | #271 | Tragic 15.9% |
| Belizeans | 0.0 /100 | #272 | Tragic 15.9% |
| Haitians | 0.0 /100 | #273 | Tragic 15.9% |
| Barbadians | 0.0 /100 | #274 | Tragic 15.9% |
| Immigrants | Barbados | 0.0 /100 | #275 | Tragic 16.0% |
| Central Americans | 0.0 /100 | #276 | Tragic 16.0% |
| Bangladeshis | 0.0 /100 | #277 | Tragic 16.0% |
| Immigrants | West Indies | 0.0 /100 | #278 | Tragic 16.1% |
| Immigrants | Bahamas | 0.0 /100 | #279 | Tragic 16.1% |
| Vietnamese | 0.0 /100 | #280 | Tragic 16.1% |
Demographics Similar to Immigrants from Northern Africa by Female Poverty
In terms of female poverty, the demographic groups most similar to Immigrants from Northern Africa are Immigrants from Bosnia and Herzegovina (13.2%, a difference of 0.10%), Hungarian (13.2%, a difference of 0.15%), Pennsylvania German (13.2%, a difference of 0.17%), Armenian (13.2%, a difference of 0.19%), and Immigrants from Fiji (13.2%, a difference of 0.25%).
| Demographics | Rating | Rank | Female Poverty |
| Tsimshian | 75.5 /100 | #150 | Good 13.1% |
| Immigrants | Germany | 74.9 /100 | #151 | Good 13.1% |
| Samoans | 73.6 /100 | #152 | Good 13.1% |
| Immigrants | Fiji | 71.0 /100 | #153 | Good 13.2% |
| Armenians | 70.4 /100 | #154 | Good 13.2% |
| Hungarians | 70.1 /100 | #155 | Good 13.2% |
| Immigrants | Bosnia and Herzegovina | 69.7 /100 | #156 | Good 13.2% |
| Immigrants | Northern Africa | 68.8 /100 | #157 | Good 13.2% |
| Pennsylvania Germans | 67.3 /100 | #158 | Good 13.2% |
| Costa Ricans | 63.6 /100 | #159 | Good 13.3% |
| Immigrants | Nepal | 62.7 /100 | #160 | Good 13.3% |
| Immigrants | Ethiopia | 62.5 /100 | #161 | Good 13.3% |
| Guamanians/Chamorros | 62.4 /100 | #162 | Good 13.3% |
| Immigrants | Albania | 62.4 /100 | #163 | Good 13.3% |
| Ethiopians | 62.3 /100 | #164 | Good 13.3% |