Haitian vs Lebanese Female Poverty
COMPARE
Haitian
Lebanese
Female Poverty
Female Poverty Comparison
Haitians
Lebanese
15.9%
FEMALE POVERTY
0.0/ 100
METRIC RATING
273rd/ 347
METRIC RANK
13.4%
FEMALE POVERTY
55.9/ 100
METRIC RATING
169th/ 347
METRIC RANK
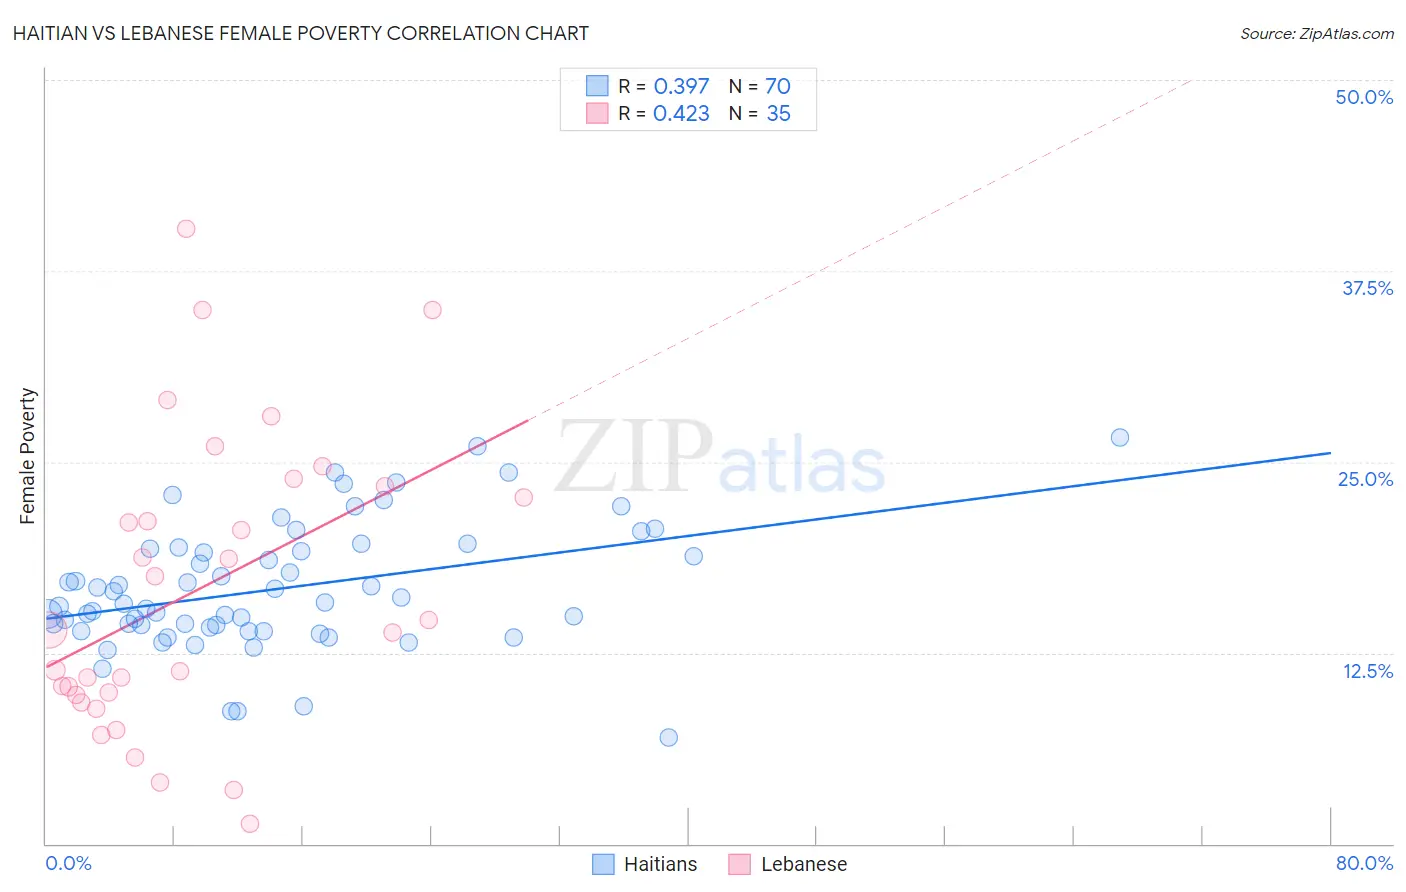
Haitian vs Lebanese Female Poverty Correlation Chart
The statistical analysis conducted on geographies consisting of 287,638,574 people shows a mild positive correlation between the proportion of Haitians and poverty level among females in the United States with a correlation coefficient (R) of 0.397 and weighted average of 15.9%. Similarly, the statistical analysis conducted on geographies consisting of 401,241,772 people shows a moderate positive correlation between the proportion of Lebanese and poverty level among females in the United States with a correlation coefficient (R) of 0.423 and weighted average of 13.4%, a difference of 19.3%.
Female Poverty Correlation Summary
| Measurement | Haitian | Lebanese |
| Minimum | 6.9% | 1.3% |
| Maximum | 26.6% | 40.3% |
| Range | 19.6% | 38.9% |
| Mean | 16.7% | 16.6% |
| Median | 15.8% | 14.0% |
| Interquartile 25% (IQ1) | 14.1% | 9.8% |
| Interquartile 75% (IQ3) | 19.3% | 23.4% |
| Interquartile Range (IQR) | 5.2% | 13.6% |
| Standard Deviation (Sample) | 4.1% | 9.6% |
| Standard Deviation (Population) | 4.1% | 9.5% |
Similar Demographics by Female Poverty
Demographics Similar to Haitians by Female Poverty
In terms of female poverty, the demographic groups most similar to Haitians are Belizean (15.9%, a difference of 0.0%), Barbadian (15.9%, a difference of 0.0%), Immigrants from Barbados (16.0%, a difference of 0.070%), Central American (16.0%, a difference of 0.20%), and Immigrants from St. Vincent and the Grenadines (15.9%, a difference of 0.23%).
| Demographics | Rating | Rank | Female Poverty |
| Immigrants | El Salvador | 0.1 /100 | #266 | Tragic 15.7% |
| Sub-Saharan Africans | 0.1 /100 | #267 | Tragic 15.8% |
| Immigrants | Nicaragua | 0.1 /100 | #268 | Tragic 15.8% |
| Iroquois | 0.1 /100 | #269 | Tragic 15.8% |
| Chickasaw | 0.1 /100 | #270 | Tragic 15.9% |
| Immigrants | St. Vincent and the Grenadines | 0.0 /100 | #271 | Tragic 15.9% |
| Belizeans | 0.0 /100 | #272 | Tragic 15.9% |
| Haitians | 0.0 /100 | #273 | Tragic 15.9% |
| Barbadians | 0.0 /100 | #274 | Tragic 15.9% |
| Immigrants | Barbados | 0.0 /100 | #275 | Tragic 16.0% |
| Central Americans | 0.0 /100 | #276 | Tragic 16.0% |
| Bangladeshis | 0.0 /100 | #277 | Tragic 16.0% |
| Immigrants | West Indies | 0.0 /100 | #278 | Tragic 16.1% |
| Immigrants | Bahamas | 0.0 /100 | #279 | Tragic 16.1% |
| Vietnamese | 0.0 /100 | #280 | Tragic 16.1% |
Demographics Similar to Lebanese by Female Poverty
In terms of female poverty, the demographic groups most similar to Lebanese are Colombian (13.4%, a difference of 0.020%), Aleut (13.4%, a difference of 0.080%), White/Caucasian (13.4%, a difference of 0.13%), Immigrants from Chile (13.3%, a difference of 0.14%), and Mongolian (13.4%, a difference of 0.23%).
| Demographics | Rating | Rank | Female Poverty |
| Guamanians/Chamorros | 62.4 /100 | #162 | Good 13.3% |
| Immigrants | Albania | 62.4 /100 | #163 | Good 13.3% |
| Ethiopians | 62.3 /100 | #164 | Good 13.3% |
| Scotch-Irish | 62.1 /100 | #165 | Good 13.3% |
| Immigrants | Oceania | 59.7 /100 | #166 | Average 13.3% |
| Immigrants | Chile | 57.4 /100 | #167 | Average 13.3% |
| Aleuts | 56.7 /100 | #168 | Average 13.4% |
| Lebanese | 55.9 /100 | #169 | Average 13.4% |
| Colombians | 55.7 /100 | #170 | Average 13.4% |
| Whites/Caucasians | 54.6 /100 | #171 | Average 13.4% |
| Mongolians | 53.6 /100 | #172 | Average 13.4% |
| Immigrants | Afghanistan | 50.8 /100 | #173 | Average 13.4% |
| Immigrants | Iraq | 50.0 /100 | #174 | Average 13.4% |
| Celtics | 49.9 /100 | #175 | Average 13.4% |
| Immigrants | Spain | 49.9 /100 | #176 | Average 13.4% |