Haitian vs Northern European Female Poverty
COMPARE
Haitian
Northern European
Female Poverty
Female Poverty Comparison
Haitians
Northern Europeans
15.9%
FEMALE POVERTY
0.0/ 100
METRIC RATING
273rd/ 347
METRIC RANK
12.4%
FEMALE POVERTY
96.6/ 100
METRIC RATING
84th/ 347
METRIC RANK
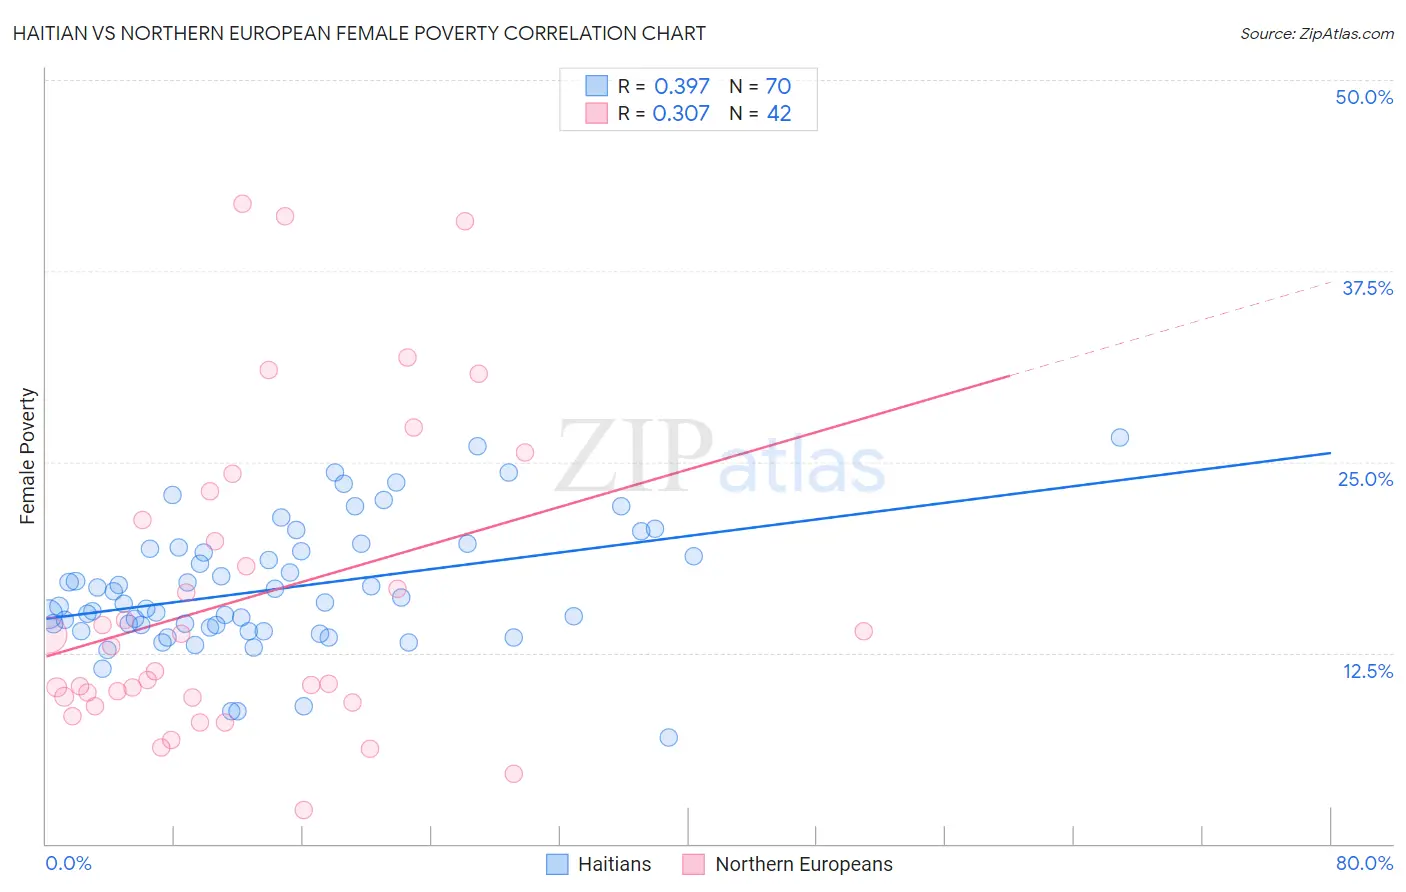
Haitian vs Northern European Female Poverty Correlation Chart
The statistical analysis conducted on geographies consisting of 287,638,574 people shows a mild positive correlation between the proportion of Haitians and poverty level among females in the United States with a correlation coefficient (R) of 0.397 and weighted average of 15.9%. Similarly, the statistical analysis conducted on geographies consisting of 405,818,739 people shows a mild positive correlation between the proportion of Northern Europeans and poverty level among females in the United States with a correlation coefficient (R) of 0.307 and weighted average of 12.4%, a difference of 29.0%.
Female Poverty Correlation Summary
| Measurement | Haitian | Northern European |
| Minimum | 6.9% | 2.2% |
| Maximum | 26.6% | 41.9% |
| Range | 19.6% | 39.7% |
| Mean | 16.7% | 16.1% |
| Median | 15.8% | 12.1% |
| Interquartile 25% (IQ1) | 14.1% | 9.5% |
| Interquartile 75% (IQ3) | 19.3% | 21.2% |
| Interquartile Range (IQR) | 5.2% | 11.6% |
| Standard Deviation (Sample) | 4.1% | 10.2% |
| Standard Deviation (Population) | 4.1% | 10.1% |
Similar Demographics by Female Poverty
Demographics Similar to Haitians by Female Poverty
In terms of female poverty, the demographic groups most similar to Haitians are Belizean (15.9%, a difference of 0.0%), Barbadian (15.9%, a difference of 0.0%), Immigrants from Barbados (16.0%, a difference of 0.070%), Central American (16.0%, a difference of 0.20%), and Immigrants from St. Vincent and the Grenadines (15.9%, a difference of 0.23%).
| Demographics | Rating | Rank | Female Poverty |
| Immigrants | El Salvador | 0.1 /100 | #266 | Tragic 15.7% |
| Sub-Saharan Africans | 0.1 /100 | #267 | Tragic 15.8% |
| Immigrants | Nicaragua | 0.1 /100 | #268 | Tragic 15.8% |
| Iroquois | 0.1 /100 | #269 | Tragic 15.8% |
| Chickasaw | 0.1 /100 | #270 | Tragic 15.9% |
| Immigrants | St. Vincent and the Grenadines | 0.0 /100 | #271 | Tragic 15.9% |
| Belizeans | 0.0 /100 | #272 | Tragic 15.9% |
| Haitians | 0.0 /100 | #273 | Tragic 15.9% |
| Barbadians | 0.0 /100 | #274 | Tragic 15.9% |
| Immigrants | Barbados | 0.0 /100 | #275 | Tragic 16.0% |
| Central Americans | 0.0 /100 | #276 | Tragic 16.0% |
| Bangladeshis | 0.0 /100 | #277 | Tragic 16.0% |
| Immigrants | West Indies | 0.0 /100 | #278 | Tragic 16.1% |
| Immigrants | Bahamas | 0.0 /100 | #279 | Tragic 16.1% |
| Vietnamese | 0.0 /100 | #280 | Tragic 16.1% |
Demographics Similar to Northern Europeans by Female Poverty
In terms of female poverty, the demographic groups most similar to Northern Europeans are Irish (12.4%, a difference of 0.050%), Dutch (12.4%, a difference of 0.080%), Okinawan (12.4%, a difference of 0.10%), Finnish (12.4%, a difference of 0.15%), and Immigrants from England (12.3%, a difference of 0.23%).
| Demographics | Rating | Rank | Female Poverty |
| Serbians | 97.2 /100 | #77 | Exceptional 12.3% |
| Egyptians | 97.2 /100 | #78 | Exceptional 12.3% |
| Immigrants | North America | 97.1 /100 | #79 | Exceptional 12.3% |
| Slovaks | 97.1 /100 | #80 | Exceptional 12.3% |
| Immigrants | Sweden | 97.1 /100 | #81 | Exceptional 12.3% |
| Jordanians | 97.1 /100 | #82 | Exceptional 12.3% |
| Immigrants | England | 96.9 /100 | #83 | Exceptional 12.3% |
| Northern Europeans | 96.6 /100 | #84 | Exceptional 12.4% |
| Irish | 96.5 /100 | #85 | Exceptional 12.4% |
| Dutch | 96.5 /100 | #86 | Exceptional 12.4% |
| Okinawans | 96.4 /100 | #87 | Exceptional 12.4% |
| Finns | 96.4 /100 | #88 | Exceptional 12.4% |
| English | 96.1 /100 | #89 | Exceptional 12.4% |
| Immigrants | Denmark | 95.8 /100 | #90 | Exceptional 12.4% |
| Belgians | 95.8 /100 | #91 | Exceptional 12.4% |