Guyanese vs Venezuelan Family Poverty
COMPARE
Guyanese
Venezuelan
Family Poverty
Family Poverty Comparison
Guyanese
Venezuelans
11.2%
FAMILY POVERTY
0.1/ 100
METRIC RATING
278th/ 347
METRIC RANK
9.3%
FAMILY POVERTY
27.4/ 100
METRIC RATING
195th/ 347
METRIC RANK
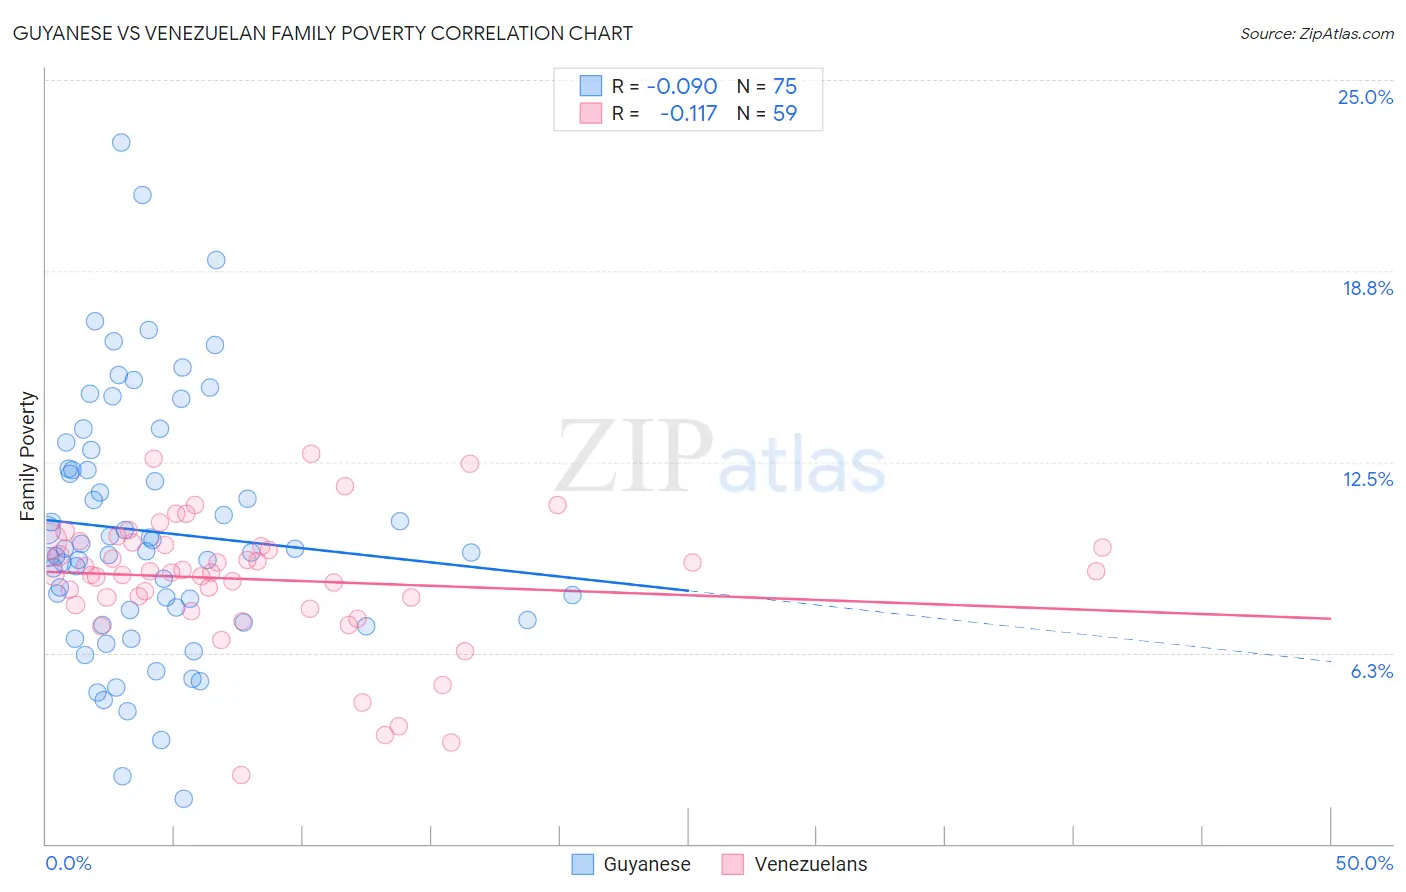
Guyanese vs Venezuelan Family Poverty Correlation Chart
The statistical analysis conducted on geographies consisting of 176,578,475 people shows a slight negative correlation between the proportion of Guyanese and poverty level among families in the United States with a correlation coefficient (R) of -0.090 and weighted average of 11.2%. Similarly, the statistical analysis conducted on geographies consisting of 305,744,356 people shows a poor negative correlation between the proportion of Venezuelans and poverty level among families in the United States with a correlation coefficient (R) of -0.117 and weighted average of 9.3%, a difference of 20.9%.
Family Poverty Correlation Summary
| Measurement | Guyanese | Venezuelan |
| Minimum | 1.5% | 2.3% |
| Maximum | 22.9% | 12.8% |
| Range | 21.5% | 10.5% |
| Mean | 10.2% | 8.6% |
| Median | 9.6% | 8.9% |
| Interquartile 25% (IQ1) | 7.3% | 7.8% |
| Interquartile 75% (IQ3) | 12.3% | 9.9% |
| Interquartile Range (IQR) | 4.9% | 2.0% |
| Standard Deviation (Sample) | 4.2% | 2.2% |
| Standard Deviation (Population) | 4.1% | 2.1% |
Similar Demographics by Family Poverty
Demographics Similar to Guyanese by Family Poverty
In terms of family poverty, the demographic groups most similar to Guyanese are Chippewa (11.2%, a difference of 0.030%), Immigrants from Guyana (11.2%, a difference of 0.12%), Central American (11.2%, a difference of 0.14%), Blackfeet (11.3%, a difference of 0.14%), and Belizean (11.3%, a difference of 0.18%).
| Demographics | Rating | Rank | Family Poverty |
| Immigrants | Bahamas | 0.1 /100 | #271 | Tragic 11.1% |
| Immigrants | Jamaica | 0.1 /100 | #272 | Tragic 11.2% |
| Somalis | 0.1 /100 | #273 | Tragic 11.2% |
| Spanish Americans | 0.1 /100 | #274 | Tragic 11.2% |
| Central Americans | 0.1 /100 | #275 | Tragic 11.2% |
| Immigrants | Guyana | 0.1 /100 | #276 | Tragic 11.2% |
| Chippewa | 0.1 /100 | #277 | Tragic 11.2% |
| Guyanese | 0.1 /100 | #278 | Tragic 11.2% |
| Blackfeet | 0.0 /100 | #279 | Tragic 11.3% |
| Belizeans | 0.0 /100 | #280 | Tragic 11.3% |
| Immigrants | West Indies | 0.0 /100 | #281 | Tragic 11.3% |
| Immigrants | Cuba | 0.0 /100 | #282 | Tragic 11.3% |
| Indonesians | 0.0 /100 | #283 | Tragic 11.3% |
| Yaqui | 0.0 /100 | #284 | Tragic 11.3% |
| Barbadians | 0.0 /100 | #285 | Tragic 11.3% |
Demographics Similar to Venezuelans by Family Poverty
In terms of family poverty, the demographic groups most similar to Venezuelans are South American (9.3%, a difference of 0.12%), Immigrants from Western Asia (9.3%, a difference of 0.13%), Spanish (9.3%, a difference of 0.21%), Immigrants from Venezuela (9.3%, a difference of 0.21%), and Ugandan (9.3%, a difference of 0.22%).
| Demographics | Rating | Rank | Family Poverty |
| Immigrants | Kenya | 34.0 /100 | #188 | Fair 9.2% |
| Immigrants | Afghanistan | 32.1 /100 | #189 | Fair 9.2% |
| Arabs | 31.5 /100 | #190 | Fair 9.2% |
| Ugandans | 28.7 /100 | #191 | Fair 9.3% |
| Spanish | 28.7 /100 | #192 | Fair 9.3% |
| Immigrants | Western Asia | 28.2 /100 | #193 | Fair 9.3% |
| South Americans | 28.1 /100 | #194 | Fair 9.3% |
| Venezuelans | 27.4 /100 | #195 | Fair 9.3% |
| Immigrants | Venezuela | 26.1 /100 | #196 | Fair 9.3% |
| Immigrants | Colombia | 24.4 /100 | #197 | Fair 9.3% |
| Iraqis | 24.2 /100 | #198 | Fair 9.3% |
| Spaniards | 22.8 /100 | #199 | Fair 9.4% |
| Immigrants | Costa Rica | 21.7 /100 | #200 | Fair 9.4% |
| Immigrants | Portugal | 20.5 /100 | #201 | Fair 9.4% |
| Immigrants | Sierra Leone | 19.6 /100 | #202 | Poor 9.4% |