Guyanese vs Native Hawaiian Ambulatory Disability
COMPARE
Guyanese
Native Hawaiian
Ambulatory Disability
Ambulatory Disability Comparison
Guyanese
Native Hawaiians
6.6%
AMBULATORY DISABILITY
0.2/ 100
METRIC RATING
266th/ 347
METRIC RANK
6.5%
AMBULATORY DISABILITY
1.1/ 100
METRIC RATING
249th/ 347
METRIC RANK
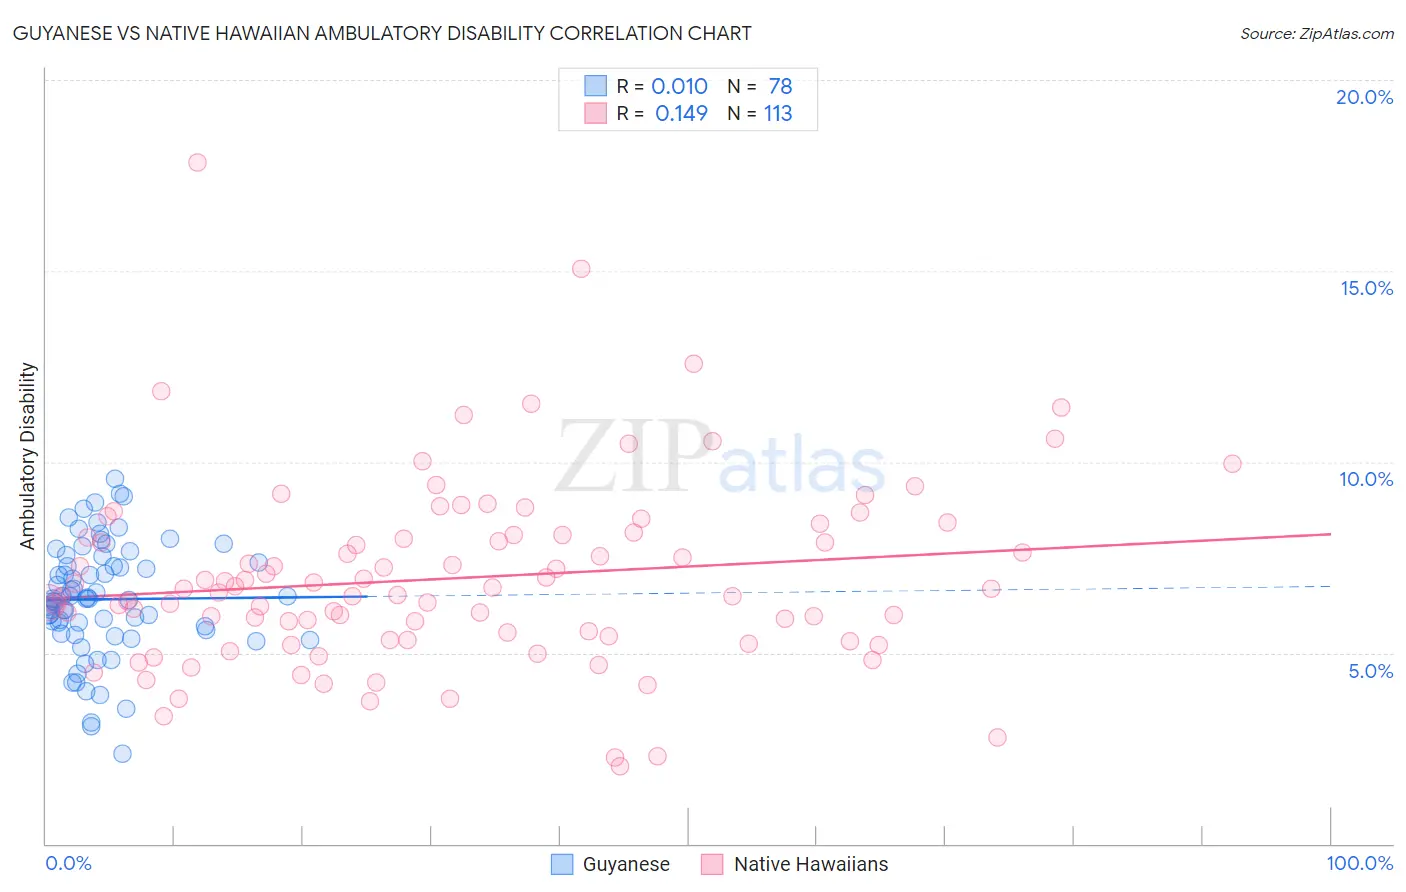
Guyanese vs Native Hawaiian Ambulatory Disability Correlation Chart
The statistical analysis conducted on geographies consisting of 176,872,924 people shows no correlation between the proportion of Guyanese and percentage of population with ambulatory disability in the United States with a correlation coefficient (R) of 0.010 and weighted average of 6.6%. Similarly, the statistical analysis conducted on geographies consisting of 331,921,721 people shows a poor positive correlation between the proportion of Native Hawaiians and percentage of population with ambulatory disability in the United States with a correlation coefficient (R) of 0.149 and weighted average of 6.5%, a difference of 2.1%.
Ambulatory Disability Correlation Summary
| Measurement | Guyanese | Native Hawaiian |
| Minimum | 2.4% | 2.0% |
| Maximum | 9.5% | 17.8% |
| Range | 7.2% | 15.8% |
| Mean | 6.4% | 6.9% |
| Median | 6.4% | 6.7% |
| Interquartile 25% (IQ1) | 5.6% | 5.4% |
| Interquartile 75% (IQ3) | 7.4% | 8.1% |
| Interquartile Range (IQR) | 1.8% | 2.7% |
| Standard Deviation (Sample) | 1.5% | 2.4% |
| Standard Deviation (Population) | 1.5% | 2.4% |
Demographics Similar to Guyanese and Native Hawaiians by Ambulatory Disability
In terms of ambulatory disability, the demographic groups most similar to Guyanese are Bahamian (6.6%, a difference of 0.12%), Trinidadian and Tobagonian (6.6%, a difference of 0.13%), Nepalese (6.6%, a difference of 0.18%), Hmong (6.6%, a difference of 0.58%), and English (6.6%, a difference of 0.70%). Similarly, the demographic groups most similar to Native Hawaiians are Chinese (6.5%, a difference of 0.080%), Hawaiian (6.5%, a difference of 0.26%), Immigrants from Portugal (6.5%, a difference of 0.28%), Immigrants from Cuba (6.5%, a difference of 0.30%), and Immigrants from Bahamas (6.5%, a difference of 0.46%).
| Demographics | Rating | Rank | Ambulatory Disability |
| Immigrants | Cuba | 1.4 /100 | #247 | Tragic 6.5% |
| Immigrants | Portugal | 1.4 /100 | #248 | Tragic 6.5% |
| Native Hawaiians | 1.1 /100 | #249 | Tragic 6.5% |
| Chinese | 1.0 /100 | #250 | Tragic 6.5% |
| Hawaiians | 0.9 /100 | #251 | Tragic 6.5% |
| Immigrants | Bahamas | 0.8 /100 | #252 | Tragic 6.5% |
| Scottish | 0.7 /100 | #253 | Tragic 6.5% |
| Belizeans | 0.7 /100 | #254 | Tragic 6.5% |
| Welsh | 0.6 /100 | #255 | Tragic 6.5% |
| Immigrants | Uzbekistan | 0.6 /100 | #256 | Tragic 6.5% |
| Bermudans | 0.5 /100 | #257 | Tragic 6.5% |
| Spanish American Indians | 0.5 /100 | #258 | Tragic 6.5% |
| Aleuts | 0.4 /100 | #259 | Tragic 6.6% |
| Immigrants | Belize | 0.4 /100 | #260 | Tragic 6.6% |
| Irish | 0.4 /100 | #261 | Tragic 6.6% |
| English | 0.4 /100 | #262 | Tragic 6.6% |
| Hmong | 0.3 /100 | #263 | Tragic 6.6% |
| Nepalese | 0.2 /100 | #264 | Tragic 6.6% |
| Bahamians | 0.2 /100 | #265 | Tragic 6.6% |
| Guyanese | 0.2 /100 | #266 | Tragic 6.6% |
| Trinidadians and Tobagonians | 0.2 /100 | #267 | Tragic 6.6% |