Guyanese vs Immigrants from Netherlands Family Poverty
COMPARE
Guyanese
Immigrants from Netherlands
Family Poverty
Family Poverty Comparison
Guyanese
Immigrants from Netherlands
11.2%
FAMILY POVERTY
0.1/ 100
METRIC RATING
278th/ 347
METRIC RANK
7.7%
FAMILY POVERTY
98.6/ 100
METRIC RATING
61st/ 347
METRIC RANK
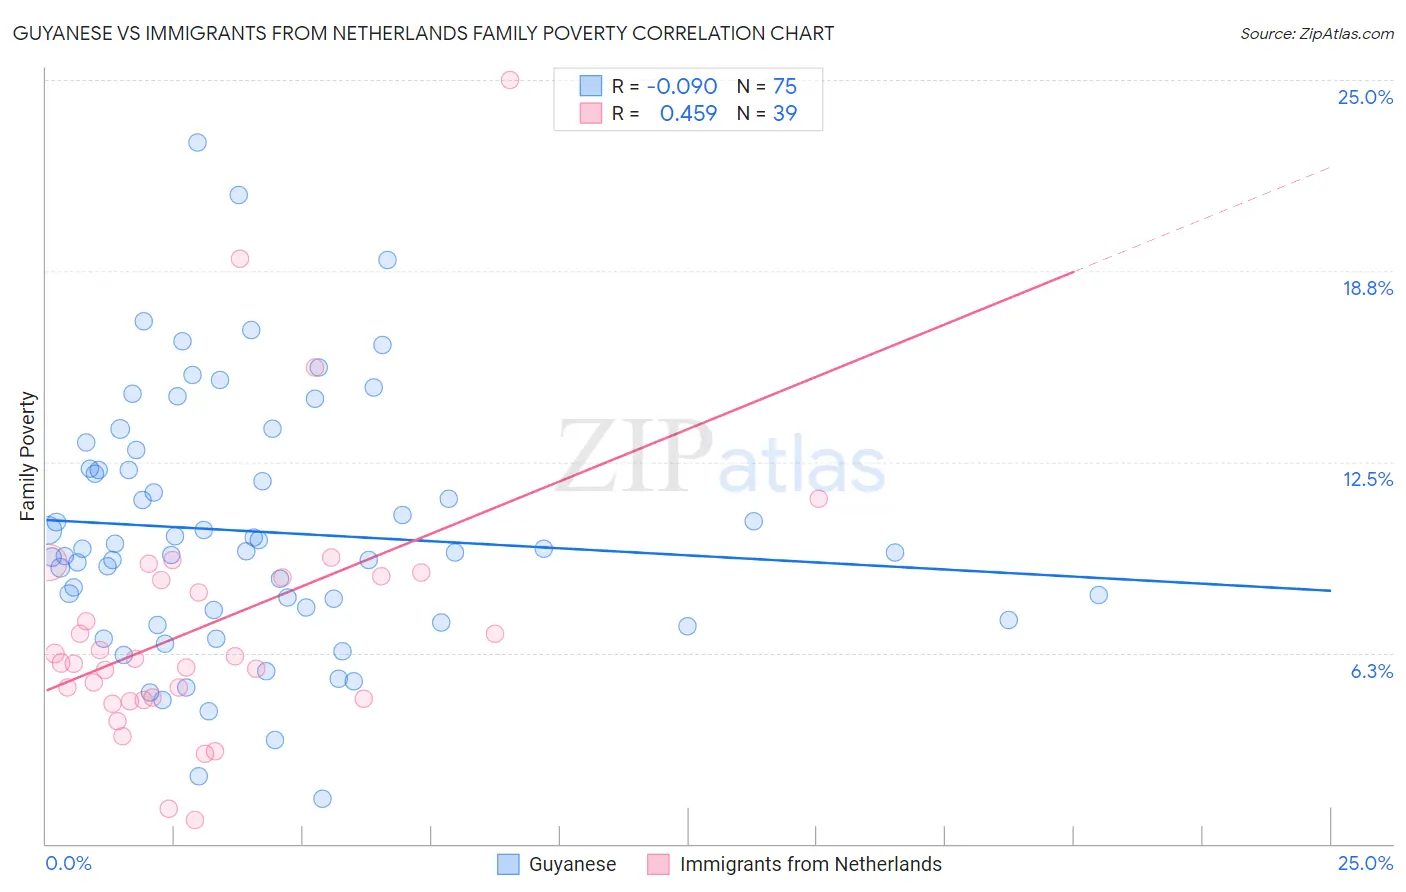
Guyanese vs Immigrants from Netherlands Family Poverty Correlation Chart
The statistical analysis conducted on geographies consisting of 176,578,475 people shows a slight negative correlation between the proportion of Guyanese and poverty level among families in the United States with a correlation coefficient (R) of -0.090 and weighted average of 11.2%. Similarly, the statistical analysis conducted on geographies consisting of 237,430,105 people shows a moderate positive correlation between the proportion of Immigrants from Netherlands and poverty level among families in the United States with a correlation coefficient (R) of 0.459 and weighted average of 7.7%, a difference of 45.1%.
Family Poverty Correlation Summary
| Measurement | Guyanese | Immigrants from Netherlands |
| Minimum | 1.5% | 0.78% |
| Maximum | 22.9% | 25.0% |
| Range | 21.5% | 24.2% |
| Mean | 10.2% | 7.2% |
| Median | 9.6% | 6.1% |
| Interquartile 25% (IQ1) | 7.3% | 4.7% |
| Interquartile 75% (IQ3) | 12.3% | 8.7% |
| Interquartile Range (IQR) | 4.9% | 4.0% |
| Standard Deviation (Sample) | 4.2% | 4.5% |
| Standard Deviation (Population) | 4.1% | 4.4% |
Similar Demographics by Family Poverty
Demographics Similar to Guyanese by Family Poverty
In terms of family poverty, the demographic groups most similar to Guyanese are Chippewa (11.2%, a difference of 0.030%), Immigrants from Guyana (11.2%, a difference of 0.12%), Central American (11.2%, a difference of 0.14%), Blackfeet (11.3%, a difference of 0.14%), and Belizean (11.3%, a difference of 0.18%).
| Demographics | Rating | Rank | Family Poverty |
| Immigrants | Bahamas | 0.1 /100 | #271 | Tragic 11.1% |
| Immigrants | Jamaica | 0.1 /100 | #272 | Tragic 11.2% |
| Somalis | 0.1 /100 | #273 | Tragic 11.2% |
| Spanish Americans | 0.1 /100 | #274 | Tragic 11.2% |
| Central Americans | 0.1 /100 | #275 | Tragic 11.2% |
| Immigrants | Guyana | 0.1 /100 | #276 | Tragic 11.2% |
| Chippewa | 0.1 /100 | #277 | Tragic 11.2% |
| Guyanese | 0.1 /100 | #278 | Tragic 11.2% |
| Blackfeet | 0.0 /100 | #279 | Tragic 11.3% |
| Belizeans | 0.0 /100 | #280 | Tragic 11.3% |
| Immigrants | West Indies | 0.0 /100 | #281 | Tragic 11.3% |
| Immigrants | Cuba | 0.0 /100 | #282 | Tragic 11.3% |
| Indonesians | 0.0 /100 | #283 | Tragic 11.3% |
| Yaqui | 0.0 /100 | #284 | Tragic 11.3% |
| Barbadians | 0.0 /100 | #285 | Tragic 11.3% |
Demographics Similar to Immigrants from Netherlands by Family Poverty
In terms of family poverty, the demographic groups most similar to Immigrants from Netherlands are Immigrants from Greece (7.7%, a difference of 0.18%), European (7.7%, a difference of 0.19%), Macedonian (7.8%, a difference of 0.19%), Finnish (7.7%, a difference of 0.20%), and Asian (7.7%, a difference of 0.23%).
| Demographics | Rating | Rank | Family Poverty |
| Immigrants | Sweden | 98.8 /100 | #54 | Exceptional 7.7% |
| Immigrants | Eastern Asia | 98.7 /100 | #55 | Exceptional 7.7% |
| Immigrants | Serbia | 98.7 /100 | #56 | Exceptional 7.7% |
| Asians | 98.7 /100 | #57 | Exceptional 7.7% |
| Finns | 98.7 /100 | #58 | Exceptional 7.7% |
| Europeans | 98.7 /100 | #59 | Exceptional 7.7% |
| Immigrants | Greece | 98.7 /100 | #60 | Exceptional 7.7% |
| Immigrants | Netherlands | 98.6 /100 | #61 | Exceptional 7.7% |
| Macedonians | 98.6 /100 | #62 | Exceptional 7.8% |
| Zimbabweans | 98.4 /100 | #63 | Exceptional 7.8% |
| Koreans | 98.3 /100 | #64 | Exceptional 7.8% |
| Immigrants | Bulgaria | 98.3 /100 | #65 | Exceptional 7.8% |
| Dutch | 98.3 /100 | #66 | Exceptional 7.8% |
| Northern Europeans | 98.3 /100 | #67 | Exceptional 7.8% |
| Australians | 98.2 /100 | #68 | Exceptional 7.8% |