Immigrants from Croatia vs Macedonian Single Mother Poverty
COMPARE
Immigrants from Croatia
Macedonian
Single Mother Poverty
Single Mother Poverty Comparison
Immigrants from Croatia
Macedonians
28.0%
SINGLE MOTHER POVERTY
96.7/ 100
METRIC RATING
102nd/ 347
METRIC RANK
27.4%
SINGLE MOTHER POVERTY
99.4/ 100
METRIC RATING
71st/ 347
METRIC RANK
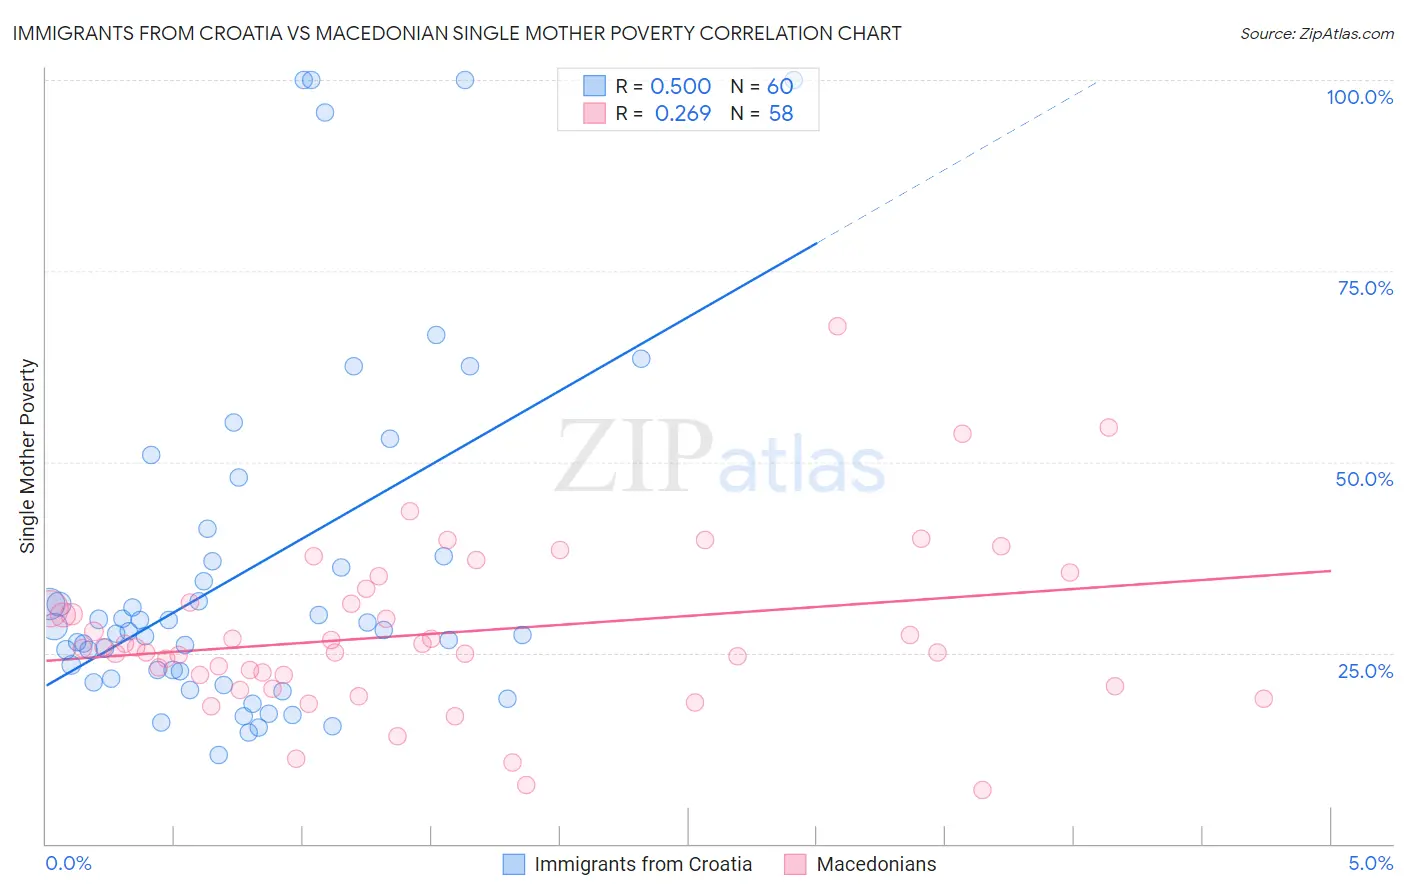
Immigrants from Croatia vs Macedonian Single Mother Poverty Correlation Chart
The statistical analysis conducted on geographies consisting of 130,792,597 people shows a moderate positive correlation between the proportion of Immigrants from Croatia and poverty level among single mothers in the United States with a correlation coefficient (R) of 0.500 and weighted average of 28.0%. Similarly, the statistical analysis conducted on geographies consisting of 130,650,018 people shows a weak positive correlation between the proportion of Macedonians and poverty level among single mothers in the United States with a correlation coefficient (R) of 0.269 and weighted average of 27.4%, a difference of 2.1%.
Single Mother Poverty Correlation Summary
| Measurement | Immigrants from Croatia | Macedonian |
| Minimum | 11.6% | 7.0% |
| Maximum | 100.0% | 67.8% |
| Range | 88.4% | 60.8% |
| Mean | 35.8% | 27.6% |
| Median | 27.9% | 25.7% |
| Interquartile 25% (IQ1) | 22.2% | 22.1% |
| Interquartile 75% (IQ3) | 37.3% | 31.6% |
| Interquartile Range (IQR) | 15.1% | 9.5% |
| Standard Deviation (Sample) | 23.1% | 11.0% |
| Standard Deviation (Population) | 22.9% | 10.9% |
Similar Demographics by Single Mother Poverty
Demographics Similar to Immigrants from Croatia by Single Mother Poverty
In terms of single mother poverty, the demographic groups most similar to Immigrants from Croatia are Immigrants from Northern Africa (28.0%, a difference of 0.020%), Italian (28.0%, a difference of 0.030%), Israeli (28.0%, a difference of 0.060%), Pakistani (28.0%, a difference of 0.10%), and Ukrainian (28.0%, a difference of 0.10%).
| Demographics | Rating | Rank | Single Mother Poverty |
| Chileans | 97.5 /100 | #95 | Exceptional 27.9% |
| Immigrants | Iraq | 97.3 /100 | #96 | Exceptional 27.9% |
| Immigrants | Brazil | 97.2 /100 | #97 | Exceptional 27.9% |
| Immigrants | Nepal | 97.2 /100 | #98 | Exceptional 27.9% |
| Immigrants | Netherlands | 97.2 /100 | #99 | Exceptional 27.9% |
| Zimbabweans | 97.1 /100 | #100 | Exceptional 27.9% |
| Pakistanis | 96.9 /100 | #101 | Exceptional 28.0% |
| Immigrants | Croatia | 96.7 /100 | #102 | Exceptional 28.0% |
| Immigrants | Northern Africa | 96.6 /100 | #103 | Exceptional 28.0% |
| Italians | 96.6 /100 | #104 | Exceptional 28.0% |
| Israelis | 96.5 /100 | #105 | Exceptional 28.0% |
| Ukrainians | 96.4 /100 | #106 | Exceptional 28.0% |
| Immigrants | Venezuela | 95.8 /100 | #107 | Exceptional 28.1% |
| Immigrants | Zimbabwe | 95.5 /100 | #108 | Exceptional 28.1% |
| Immigrants | Armenia | 95.2 /100 | #109 | Exceptional 28.1% |
Demographics Similar to Macedonians by Single Mother Poverty
In terms of single mother poverty, the demographic groups most similar to Macedonians are Immigrants from Belarus (27.4%, a difference of 0.020%), Immigrants from Russia (27.4%, a difference of 0.020%), Lithuanian (27.4%, a difference of 0.030%), Sierra Leonean (27.4%, a difference of 0.090%), and Immigrants from Europe (27.4%, a difference of 0.15%).
| Demographics | Rating | Rank | Single Mother Poverty |
| Russians | 99.5 /100 | #64 | Exceptional 27.3% |
| Immigrants | Turkey | 99.5 /100 | #65 | Exceptional 27.3% |
| Soviet Union | 99.5 /100 | #66 | Exceptional 27.3% |
| Immigrants | Australia | 99.5 /100 | #67 | Exceptional 27.3% |
| Immigrants | Czechoslovakia | 99.5 /100 | #68 | Exceptional 27.4% |
| Lithuanians | 99.4 /100 | #69 | Exceptional 27.4% |
| Immigrants | Belarus | 99.4 /100 | #70 | Exceptional 27.4% |
| Macedonians | 99.4 /100 | #71 | Exceptional 27.4% |
| Immigrants | Russia | 99.4 /100 | #72 | Exceptional 27.4% |
| Sierra Leoneans | 99.3 /100 | #73 | Exceptional 27.4% |
| Immigrants | Europe | 99.3 /100 | #74 | Exceptional 27.4% |
| Immigrants | Sweden | 99.2 /100 | #75 | Exceptional 27.5% |
| Peruvians | 99.2 /100 | #76 | Exceptional 27.5% |
| Immigrants | Peru | 99.2 /100 | #77 | Exceptional 27.5% |
| Immigrants | North Macedonia | 99.2 /100 | #78 | Exceptional 27.5% |