Immigrants from Egypt vs Macedonian Single Mother Poverty
COMPARE
Immigrants from Egypt
Macedonian
Single Mother Poverty
Single Mother Poverty Comparison
Immigrants from Egypt
Macedonians
27.1%
SINGLE MOTHER POVERTY
99.7/ 100
METRIC RATING
55th/ 347
METRIC RANK
27.4%
SINGLE MOTHER POVERTY
99.4/ 100
METRIC RATING
71st/ 347
METRIC RANK
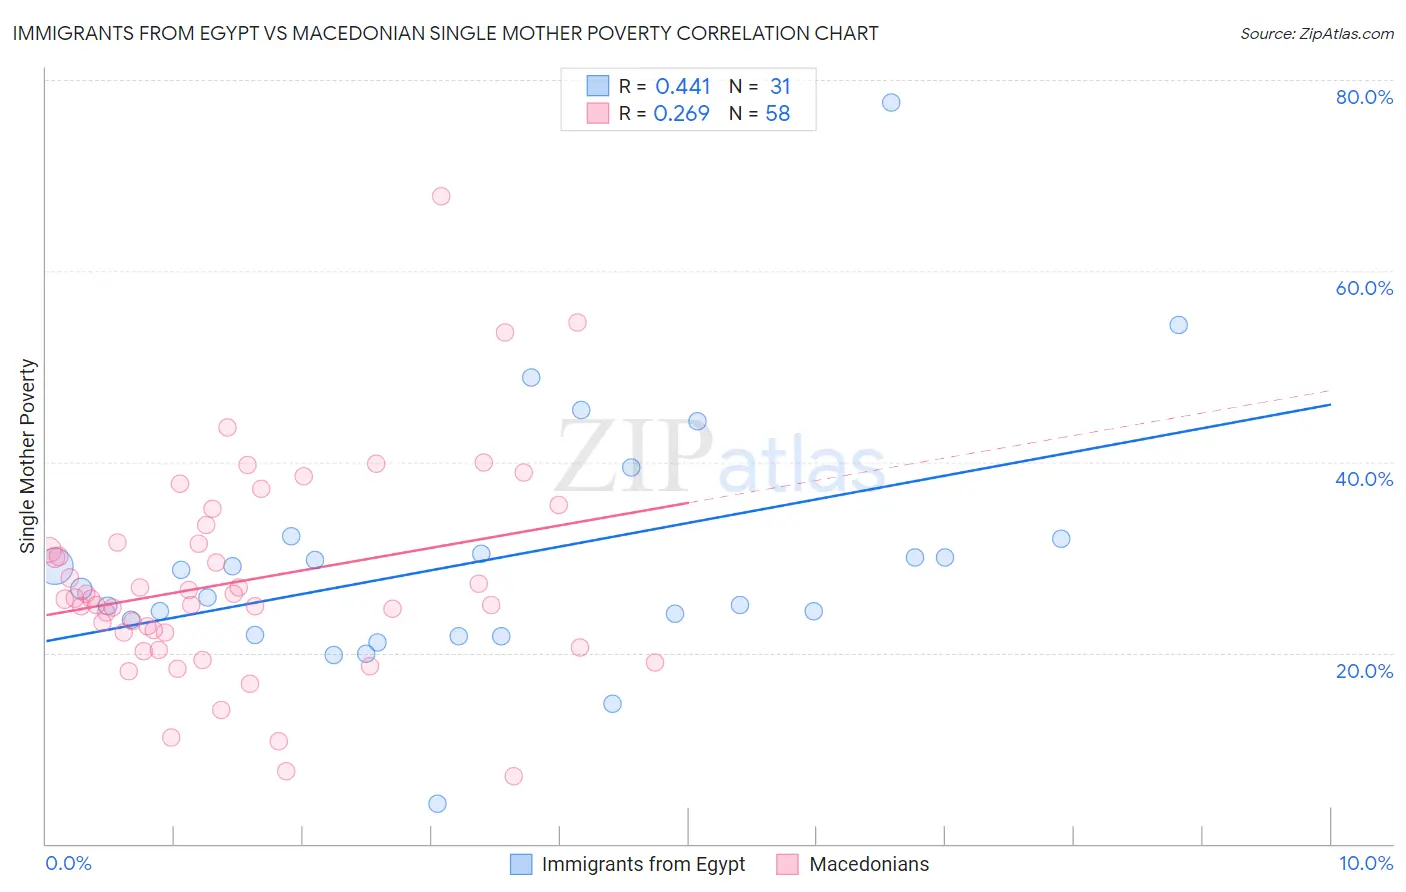
Immigrants from Egypt vs Macedonian Single Mother Poverty Correlation Chart
The statistical analysis conducted on geographies consisting of 241,181,927 people shows a moderate positive correlation between the proportion of Immigrants from Egypt and poverty level among single mothers in the United States with a correlation coefficient (R) of 0.441 and weighted average of 27.1%. Similarly, the statistical analysis conducted on geographies consisting of 130,650,018 people shows a weak positive correlation between the proportion of Macedonians and poverty level among single mothers in the United States with a correlation coefficient (R) of 0.269 and weighted average of 27.4%, a difference of 0.97%.
Single Mother Poverty Correlation Summary
| Measurement | Immigrants from Egypt | Macedonian |
| Minimum | 4.2% | 7.0% |
| Maximum | 77.6% | 67.8% |
| Range | 73.4% | 60.8% |
| Mean | 29.8% | 27.6% |
| Median | 26.7% | 25.7% |
| Interquartile 25% (IQ1) | 21.9% | 22.1% |
| Interquartile 75% (IQ3) | 31.9% | 31.6% |
| Interquartile Range (IQR) | 10.1% | 9.5% |
| Standard Deviation (Sample) | 13.4% | 11.0% |
| Standard Deviation (Population) | 13.2% | 10.9% |
Demographics Similar to Immigrants from Egypt and Macedonians by Single Mother Poverty
In terms of single mother poverty, the demographic groups most similar to Immigrants from Egypt are Immigrants from Bulgaria (27.1%, a difference of 0.030%), Immigrants from Romania (27.2%, a difference of 0.050%), Immigrants from Jordan (27.1%, a difference of 0.060%), Palestinian (27.2%, a difference of 0.080%), and Argentinean (27.2%, a difference of 0.23%). Similarly, the demographic groups most similar to Macedonians are Immigrants from Belarus (27.4%, a difference of 0.020%), Immigrants from Russia (27.4%, a difference of 0.020%), Lithuanian (27.4%, a difference of 0.030%), Sierra Leonean (27.4%, a difference of 0.090%), and Immigrants from Czechoslovakia (27.4%, a difference of 0.19%).
| Demographics | Rating | Rank | Single Mother Poverty |
| Immigrants | Jordan | 99.7 /100 | #53 | Exceptional 27.1% |
| Immigrants | Bulgaria | 99.7 /100 | #54 | Exceptional 27.1% |
| Immigrants | Egypt | 99.7 /100 | #55 | Exceptional 27.1% |
| Immigrants | Romania | 99.7 /100 | #56 | Exceptional 27.2% |
| Palestinians | 99.7 /100 | #57 | Exceptional 27.2% |
| Argentineans | 99.6 /100 | #58 | Exceptional 27.2% |
| Paraguayans | 99.6 /100 | #59 | Exceptional 27.2% |
| Eastern Europeans | 99.6 /100 | #60 | Exceptional 27.2% |
| Immigrants | Eastern Europe | 99.6 /100 | #61 | Exceptional 27.2% |
| Immigrants | Malaysia | 99.5 /100 | #62 | Exceptional 27.3% |
| Immigrants | Northern Europe | 99.5 /100 | #63 | Exceptional 27.3% |
| Russians | 99.5 /100 | #64 | Exceptional 27.3% |
| Immigrants | Turkey | 99.5 /100 | #65 | Exceptional 27.3% |
| Soviet Union | 99.5 /100 | #66 | Exceptional 27.3% |
| Immigrants | Australia | 99.5 /100 | #67 | Exceptional 27.3% |
| Immigrants | Czechoslovakia | 99.5 /100 | #68 | Exceptional 27.4% |
| Lithuanians | 99.4 /100 | #69 | Exceptional 27.4% |
| Immigrants | Belarus | 99.4 /100 | #70 | Exceptional 27.4% |
| Macedonians | 99.4 /100 | #71 | Exceptional 27.4% |
| Immigrants | Russia | 99.4 /100 | #72 | Exceptional 27.4% |
| Sierra Leoneans | 99.3 /100 | #73 | Exceptional 27.4% |