Guyanese vs Immigrants from Hong Kong Cognitive Disability

COMPARE

Guyanese
Race
Ancestry
AfghanAfricanAlaska NativeAlaskan AthabascanAlbanianAleutAlsatianAmericanApacheArabArapahoArgentineanArmenianAssyrian/Chaldean/SyriacAustralianAustrianBahamianBangladeshiBarbadianBasqueBelgianBelizeanBermudanBhutaneseBlackfeetBolivianBrazilianBritishBritish West IndianBulgarianBurmeseCajunCambodianCanadianCape VerdeanCarpatho RusynCelticCentral AmericanCentral American IndianCherokeeCheyenneChickasawChileanChineseChippewaChoctawColombianColvilleComancheCosta RicanCreeCreekCroatianCrowCubanCypriotCzechCzechoslovakianDanishDelawareDominicanDutchDutch West IndianEastern EuropeanEcuadorianEgyptianEnglishEstonianEthiopianEuropeanFijianFilipinoFinnishFrenchFrench American IndianFrench CanadianGermanGerman RussianGhanaianGreekGuamanian/ChamorroGuatemalanGuyaneseHaitianHmongHonduranHopiHoumaHungarianIcelanderIndian (Asian)IndonesianInupiatIranianIraqiIrishIroquoisIsraeliItalianJamaicanJapaneseJordanianKenyanKiowaKoreanLaotianLatvianLebaneseLiberianLithuanianLumbeeLuxembourgerMacedonianMalaysianMalteseMarshalleseMenomineeMexicanMexican American IndianMongolianMoroccanNative HawaiianNavajoNepaleseNew ZealanderNicaraguanNigerianNorthern EuropeanNorwegianOkinawanOsageOttawaPaiutePakistaniPalestinianPanamanianParaguayanPennsylvania GermanPeruvianPimaPolishPortuguesePotawatomiPuebloPuerto RicanPuget Sound SalishRomanianRussianSalvadoranSamoanScandinavianScotch-IrishScottishSeminoleSenegaleseSerbianShoshoneSierra LeoneanSiouxSlavicSlovakSloveneSomaliSouth AfricanSouth AmericanSouth American IndianSoviet UnionSpaniardSpanishSpanish AmericanSpanish American IndianSri LankanSubsaharan AfricanSudaneseSwedishSwissSyrianTaiwaneseThaiTlingit-HaidaTohono O'OdhamTonganTrinidadian and TobagonianTsimshianTurkishU.S. Virgin IslanderUgandanUkrainianUruguayanUteVenezuelanVietnameseWelshWest IndianYakamaYaquiYugoslavianYumanYup'ikZimbabwean
Immigration
NonimmigrantsImmigrantsAfghanistanAfricaAlbaniaArgentinaArmeniaAsiaAustraliaAustriaBahamasBangladeshBarbadosBelarusBelgiumBelizeBoliviaBosnia and HerzegovinaBrazilBulgariaBurma/MyanmarCabo VerdeCambodiaCameroonCanadaCaribbeanCentral AmericaChileChinaColombiaCongoCosta RicaCroatiaCubaCzechoslovakiaDenmarkDominicaDominican RepublicEastern AfricaEastern AsiaEastern EuropeEcuadorEgyptEl SalvadorEnglandEritreaEthiopiaEuropeFijiFranceGermanyGhanaGreeceGrenadaGuatemalaGuyanaHaitiHondurasHungaryIndiaIndonesiaIranIraqIrelandIsraelItalyJamaicaJapanJordanKazakhstanKenyaKoreaKuwaitLaosLatin AmericaLatviaLebanonLiberiaLithuaniaMalaysiaMexicoMicronesiaMiddle AfricaMoldovaMoroccoNepalNetherlandsNicaraguaNigeriaNorth AmericaNorth MacedoniaNorthern AfricaNorthern EuropeNorwayOceaniaPakistanPanamaPeruPhilippinesPolandPortugalRomaniaRussiaSaudi ArabiaScotlandSenegalSerbiaSierra LeoneSingaporeSomaliaSouth AfricaSouth AmericaSouth Central AsiaSouth Eastern AsiaSouthern EuropeSpainSri LankaSt. Vincent and the GrenadinesSudanSwedenSwitzerlandSyriaTaiwanThailandTrinidad and TobagoTurkeyUgandaUkraineUruguayUzbekistanVenezuelaVietnamWest IndiesWestern AfricaWestern AsiaWestern EuropeYemenZaireZimbabweAzores
Immigrants from Hong Kong
Race
Ancestry
AfghanAfricanAlaska NativeAlaskan AthabascanAlbanianAleutAlsatianAmericanApacheArabArapahoArgentineanArmenianAssyrian/Chaldean/SyriacAustralianAustrianBahamianBangladeshiBarbadianBasqueBelgianBelizeanBermudanBhutaneseBlackfeetBolivianBrazilianBritishBritish West IndianBulgarianBurmeseCajunCambodianCanadianCape VerdeanCarpatho RusynCelticCentral AmericanCentral American IndianCherokeeCheyenneChickasawChileanChineseChippewaChoctawColombianColvilleComancheCosta RicanCreeCreekCroatianCrowCubanCypriotCzechCzechoslovakianDanishDelawareDominicanDutchDutch West IndianEastern EuropeanEcuadorianEgyptianEnglishEstonianEthiopianEuropeanFijianFilipinoFinnishFrenchFrench American IndianFrench CanadianGermanGerman RussianGhanaianGreekGuamanian/ChamorroGuatemalanHaitianHmongHonduranHopiHoumaHungarianIcelanderIndian (Asian)IndonesianInupiatIranianIraqiIrishIroquoisIsraeliItalianJamaicanJapaneseJordanianKenyanKiowaKoreanLaotianLatvianLebaneseLiberianLithuanianLumbeeLuxembourgerMacedonianMalaysianMalteseMarshalleseMenomineeMexicanMexican American IndianMongolianMoroccanNative HawaiianNavajoNepaleseNew ZealanderNicaraguanNigerianNorthern EuropeanNorwegianOkinawanOsageOttawaPaiutePakistaniPalestinianPanamanianParaguayanPennsylvania GermanPeruvianPimaPolishPortuguesePotawatomiPuebloPuerto RicanPuget Sound SalishRomanianRussianSalvadoranSamoanScandinavianScotch-IrishScottishSeminoleSenegaleseSerbianShoshoneSierra LeoneanSiouxSlavicSlovakSloveneSomaliSouth AfricanSouth AmericanSouth American IndianSoviet UnionSpaniardSpanishSpanish AmericanSpanish American IndianSri LankanSubsaharan AfricanSudaneseSwedishSwissSyrianTaiwaneseThaiTlingit-HaidaTohono O'OdhamTonganTrinidadian and TobagonianTsimshianTurkishU.S. Virgin IslanderUgandanUkrainianUruguayanUteVenezuelanVietnameseWelshWest IndianYakamaYaquiYugoslavianYumanYup'ikZimbabwean
Immigration
NonimmigrantsImmigrantsAfghanistanAfricaAlbaniaArgentinaArmeniaAsiaAustraliaAustriaBahamasBangladeshBarbadosBelarusBelgiumBelizeBoliviaBosnia and HerzegovinaBrazilBulgariaBurma/MyanmarCabo VerdeCambodiaCameroonCanadaCaribbeanCentral AmericaChileChinaColombiaCongoCosta RicaCroatiaCubaCzechoslovakiaDenmarkDominicaDominican RepublicEastern AfricaEastern AsiaEastern EuropeEcuadorEgyptEl SalvadorEnglandEritreaEthiopiaEuropeFijiFranceGermanyGhanaGreeceGrenadaGuatemalaGuyanaHaitiHondurasHong KongHungaryIndiaIndonesiaIranIraqIrelandIsraelItalyJamaicaJapanJordanKazakhstanKenyaKoreaKuwaitLaosLatin AmericaLatviaLebanonLiberiaLithuaniaMalaysiaMexicoMicronesiaMiddle AfricaMoldovaMoroccoNepalNetherlandsNicaraguaNigeriaNorth AmericaNorth MacedoniaNorthern AfricaNorthern EuropeNorwayOceaniaPakistanPanamaPeruPhilippinesPolandPortugalRomaniaRussiaSaudi ArabiaScotlandSenegalSerbiaSierra LeoneSingaporeSomaliaSouth AfricaSouth AmericaSouth Central AsiaSouth Eastern AsiaSouthern EuropeSpainSri LankaSt. Vincent and the GrenadinesSudanSwedenSwitzerlandSyriaTaiwanThailandTrinidad and TobagoTurkeyUgandaUkraineUruguayUzbekistanVenezuelaVietnamWest IndiesWestern AfricaWestern AsiaWestern EuropeYemenZaireZimbabweAzores
Cognitive Disability
Income
Poverty
Unemployment
Labor Participation
Family Structure
Vehicle Availability
Education Level
Disability

Cognitive Disability Comparison

Guyanese

Immigrants from Hong Kong

Poor
Exceptional
17.5%
COGNITIVE DISABILITY
17.5/ 100
METRIC RATING
196th/ 347
METRIC RANK
16.0%
COGNITIVE DISABILITY
100.0/ 100
METRIC RATING
5th/ 347
METRIC RANK

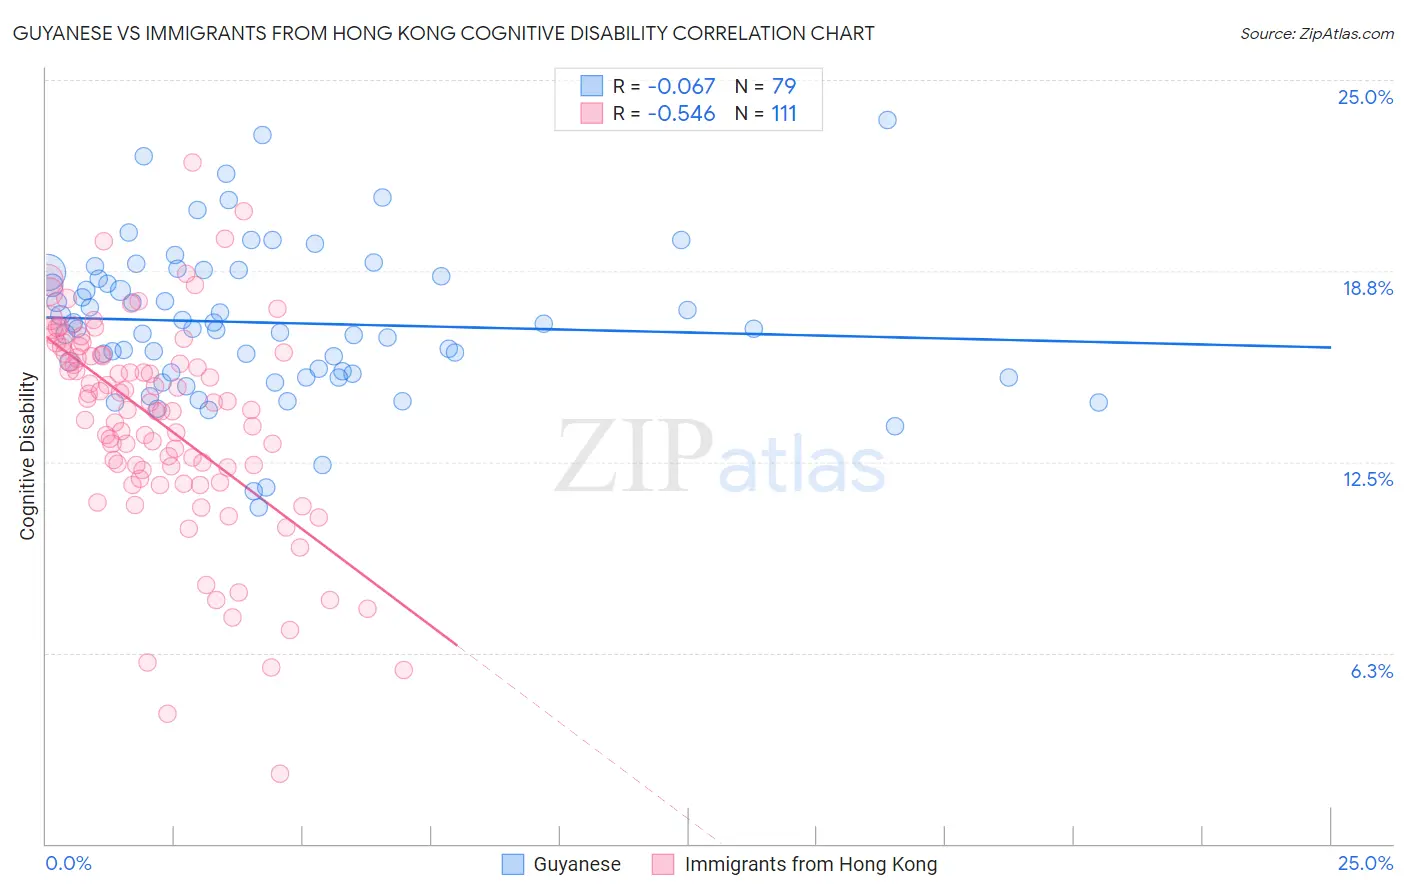
Guyanese vs Immigrants from Hong Kong Cognitive Disability Correlation Chart

The statistical analysis conducted on geographies consisting of 176,911,686 people shows a slight negative correlation between the proportion of Guyanese and percentage of population with cognitive disability in the United States with a correlation coefficient (R) of -0.067 and weighted average of 17.5%. Similarly, the statistical analysis conducted on geographies consisting of 253,985,578 people shows a substantial negative correlation between the proportion of Immigrants from Hong Kong and percentage of population with cognitive disability in the United States with a correlation coefficient (R) of -0.546 and weighted average of 16.0%, a difference of 9.0%.
Guyanese vs Immigrants from Hong Kong Cognitive Disability

Cognitive Disability Correlation Summary

MeasurementGuyaneseImmigrants from Hong Kong
Minimum11.0%2.3%
Maximum23.7%22.3%
Range12.7%20.0%
Mean17.1%13.8%
Median16.9%14.4%
Interquartile 25% (IQ1)15.4%12.2%
Interquartile 75% (IQ3)18.7%16.1%
Interquartile Range (IQR)3.3%3.9%
Standard Deviation (Sample)2.5%3.5%
Standard Deviation (Population)2.5%3.5%

Similar Demographics by Cognitive Disability

Demographics Similar to Guyanese by Cognitive Disability

In terms of cognitive disability, the demographic groups most similar to Guyanese are Immigrants from Afghanistan (17.5%, a difference of 0.040%), Immigrants from Panama (17.5%, a difference of 0.14%), New Zealander (17.4%, a difference of 0.16%), Immigrants from Singapore (17.5%, a difference of 0.17%), and Haitian (17.5%, a difference of 0.18%).
DemographicsRating | RankCognitive Disability
Immigrants | Western Asia
29.5
/100
|
#189
Fair
17.4%
Immigrants | Spain
27.7
/100
|
#190
Fair
17.4%
Immigrants | Nonimmigrants
27.4
/100
|
#191
Fair
17.4%
Immigrants | Haiti
27.1
/100
|
#192
Fair
17.4%
Delaware
25.6
/100
|
#193
Fair
17.4%
Immigrants | Bosnia and Herzegovina
22.0
/100
|
#194
Fair
17.4%
New Zealanders
21.1
/100
|
#195
Fair
17.4%
Guyanese
17.5
/100
|
#196
Poor
17.5%
Immigrants | Afghanistan
16.7
/100
|
#197
Poor
17.5%
Immigrants | Panama
14.8
/100
|
#198
Poor
17.5%
Immigrants | Singapore
14.3
/100
|
#199
Poor
17.5%
Haitians
14.1
/100
|
#200
Poor
17.5%
South American Indians
13.0
/100
|
#201
Poor
17.5%
Immigrants | Morocco
12.0
/100
|
#202
Poor
17.5%
Immigrants | Caribbean
11.0
/100
|
#203
Poor
17.5%

Demographics Similar to Immigrants from Hong Kong by Cognitive Disability

In terms of cognitive disability, the demographic groups most similar to Immigrants from Hong Kong are Immigrants from Lithuania (16.0%, a difference of 0.41%), Chinese (15.9%, a difference of 0.59%), Thai (16.1%, a difference of 0.61%), Immigrants from India (15.9%, a difference of 0.68%), and Immigrants from Ireland (16.1%, a difference of 0.72%).
DemographicsRating | RankCognitive Disability
Immigrants | Taiwan
100.0
/100
|
#1
Exceptional
15.7%
Immigrants | India
100.0
/100
|
#2
Exceptional
15.9%
Chinese
100.0
/100
|
#3
Exceptional
15.9%
Immigrants | Lithuania
100.0
/100
|
#4
Exceptional
16.0%
Immigrants | Hong Kong
100.0
/100
|
#5
Exceptional
16.0%
Thais
100.0
/100
|
#6
Exceptional
16.1%
Immigrants | Ireland
100.0
/100
|
#7
Exceptional
16.1%
Immigrants | Poland
100.0
/100
|
#8
Exceptional
16.1%
Assyrians/Chaldeans/Syriacs
100.0
/100
|
#9
Exceptional
16.2%
Immigrants | Scotland
100.0
/100
|
#10
Exceptional
16.2%
Immigrants | Czechoslovakia
100.0
/100
|
#11
Exceptional
16.2%
Maltese
100.0
/100
|
#12
Exceptional
16.2%
Lithuanians
100.0
/100
|
#13
Exceptional
16.3%
Immigrants | Austria
100.0
/100
|
#14
Exceptional
16.3%
Immigrants | Greece
100.0
/100
|
#15
Exceptional
16.3%