Guatemalan vs Senegalese Single Father Poverty
COMPARE
Guatemalan
Senegalese
Single Father Poverty
Single Father Poverty Comparison
Guatemalans
Senegalese
16.6%
SINGLE FATHER POVERTY
12.9/ 100
METRIC RATING
210th/ 347
METRIC RANK
16.9%
SINGLE FATHER POVERTY
3.2/ 100
METRIC RATING
233rd/ 347
METRIC RANK
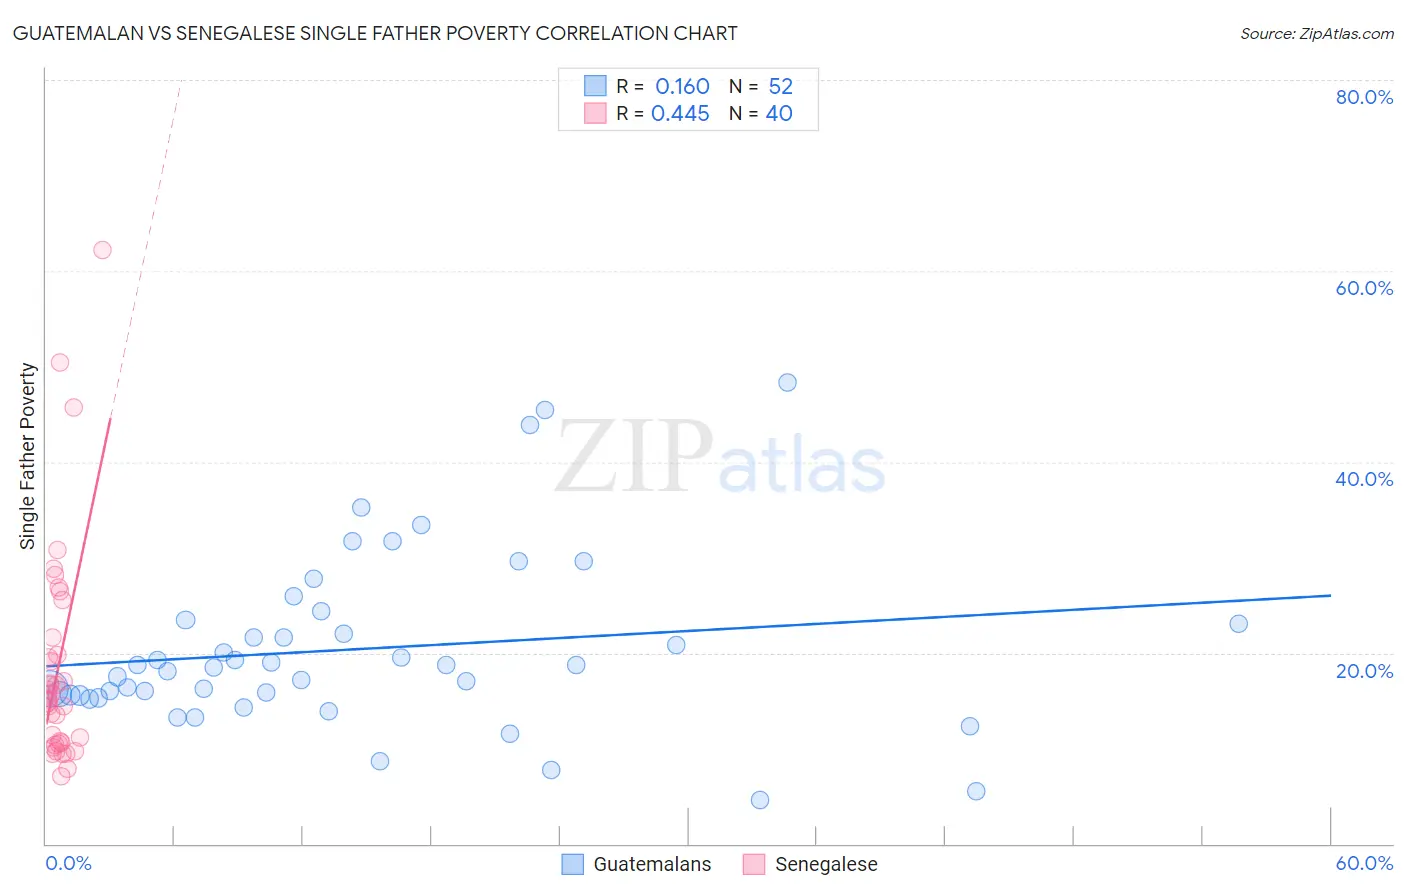
Guatemalan vs Senegalese Single Father Poverty Correlation Chart
The statistical analysis conducted on geographies consisting of 326,782,810 people shows a poor positive correlation between the proportion of Guatemalans and poverty level among single fathers in the United States with a correlation coefficient (R) of 0.160 and weighted average of 16.6%. Similarly, the statistical analysis conducted on geographies consisting of 73,350,667 people shows a moderate positive correlation between the proportion of Senegalese and poverty level among single fathers in the United States with a correlation coefficient (R) of 0.445 and weighted average of 16.9%, a difference of 1.6%.
Single Father Poverty Correlation Summary
| Measurement | Guatemalan | Senegalese |
| Minimum | 4.6% | 7.1% |
| Maximum | 48.3% | 62.2% |
| Range | 43.7% | 55.1% |
| Mean | 20.4% | 18.6% |
| Median | 18.6% | 15.2% |
| Interquartile 25% (IQ1) | 15.5% | 10.5% |
| Interquartile 75% (IQ3) | 23.2% | 20.7% |
| Interquartile Range (IQR) | 7.7% | 10.1% |
| Standard Deviation (Sample) | 9.1% | 11.8% |
| Standard Deviation (Population) | 9.1% | 11.7% |
Similar Demographics by Single Father Poverty
Demographics Similar to Guatemalans by Single Father Poverty
In terms of single father poverty, the demographic groups most similar to Guatemalans are Arab (16.6%, a difference of 0.0%), European (16.6%, a difference of 0.030%), New Zealander (16.6%, a difference of 0.070%), Eastern European (16.6%, a difference of 0.070%), and Immigrants from Senegal (16.6%, a difference of 0.080%).
| Demographics | Rating | Rank | Single Father Poverty |
| Immigrants | North America | 15.1 /100 | #203 | Poor 16.6% |
| Immigrants | Guatemala | 14.8 /100 | #204 | Poor 16.6% |
| Venezuelans | 14.3 /100 | #205 | Poor 16.6% |
| Immigrants | Senegal | 13.7 /100 | #206 | Poor 16.6% |
| New Zealanders | 13.7 /100 | #207 | Poor 16.6% |
| Eastern Europeans | 13.7 /100 | #208 | Poor 16.6% |
| Europeans | 13.2 /100 | #209 | Poor 16.6% |
| Guatemalans | 12.9 /100 | #210 | Poor 16.6% |
| Arabs | 12.8 /100 | #211 | Poor 16.6% |
| Immigrants | Southern Europe | 11.2 /100 | #212 | Poor 16.7% |
| Ghanaians | 11.0 /100 | #213 | Poor 16.7% |
| Spanish | 10.7 /100 | #214 | Poor 16.7% |
| Immigrants | Scotland | 9.6 /100 | #215 | Tragic 16.7% |
| Immigrants | England | 9.5 /100 | #216 | Tragic 16.7% |
| Cheyenne | 9.3 /100 | #217 | Tragic 16.7% |
Demographics Similar to Senegalese by Single Father Poverty
In terms of single father poverty, the demographic groups most similar to Senegalese are Marshallese (16.9%, a difference of 0.030%), Immigrants from Western Europe (16.9%, a difference of 0.12%), Immigrants from Germany (16.9%, a difference of 0.12%), Subsaharan African (16.9%, a difference of 0.13%), and Immigrants from Grenada (16.9%, a difference of 0.14%).
| Demographics | Rating | Rank | Single Father Poverty |
| Hispanics or Latinos | 6.1 /100 | #226 | Tragic 16.8% |
| British | 5.6 /100 | #227 | Tragic 16.8% |
| Belgians | 5.3 /100 | #228 | Tragic 16.8% |
| Israelis | 4.6 /100 | #229 | Tragic 16.8% |
| Immigrants | Trinidad and Tobago | 4.5 /100 | #230 | Tragic 16.8% |
| Spanish Americans | 3.7 /100 | #231 | Tragic 16.9% |
| Immigrants | Grenada | 3.7 /100 | #232 | Tragic 16.9% |
| Senegalese | 3.2 /100 | #233 | Tragic 16.9% |
| Marshallese | 3.1 /100 | #234 | Tragic 16.9% |
| Immigrants | Western Europe | 2.9 /100 | #235 | Tragic 16.9% |
| Immigrants | Germany | 2.9 /100 | #236 | Tragic 16.9% |
| Sub-Saharan Africans | 2.9 /100 | #237 | Tragic 16.9% |
| Immigrants | Saudi Arabia | 2.7 /100 | #238 | Tragic 16.9% |
| Bermudans | 2.6 /100 | #239 | Tragic 16.9% |
| Finns | 2.6 /100 | #240 | Tragic 16.9% |