Guatemalan vs Ugandan Master's Degree
COMPARE
Guatemalan
Ugandan
Master's Degree
Master's Degree Comparison
Guatemalans
Ugandans
11.7%
MASTER'S DEGREE
0.1/ 100
METRIC RATING
289th/ 347
METRIC RANK
17.1%
MASTER'S DEGREE
99.0/ 100
METRIC RATING
94th/ 347
METRIC RANK
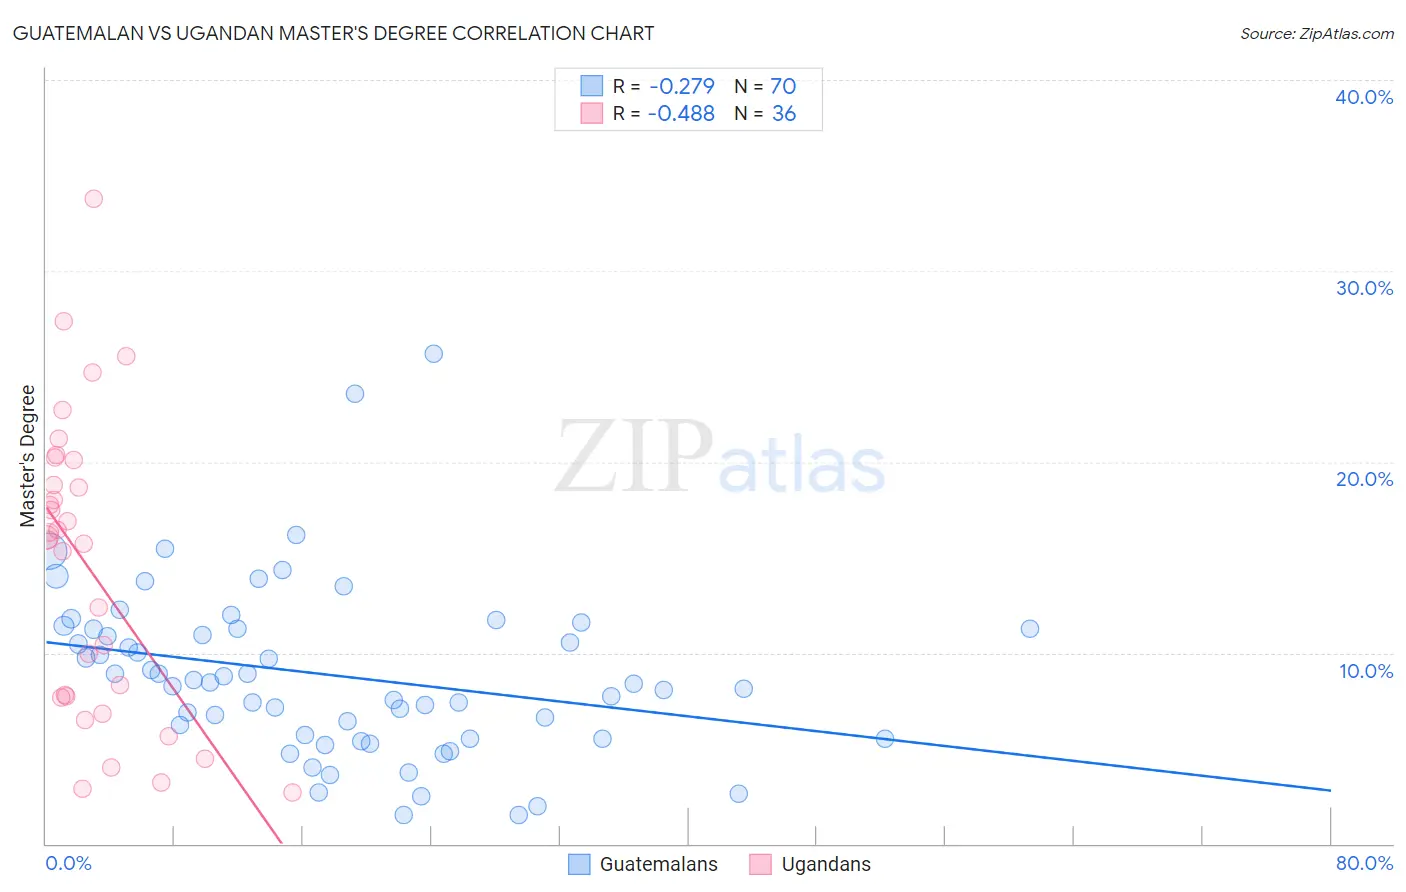
Guatemalan vs Ugandan Master's Degree Correlation Chart
The statistical analysis conducted on geographies consisting of 409,354,875 people shows a weak negative correlation between the proportion of Guatemalans and percentage of population with at least master's degree education in the United States with a correlation coefficient (R) of -0.279 and weighted average of 11.7%. Similarly, the statistical analysis conducted on geographies consisting of 93,998,017 people shows a moderate negative correlation between the proportion of Ugandans and percentage of population with at least master's degree education in the United States with a correlation coefficient (R) of -0.488 and weighted average of 17.1%, a difference of 45.8%.
Master's Degree Correlation Summary
| Measurement | Guatemalan | Ugandan |
| Minimum | 1.5% | 2.7% |
| Maximum | 25.7% | 33.8% |
| Range | 24.2% | 31.1% |
| Mean | 8.8% | 14.4% |
| Median | 8.4% | 16.0% |
| Interquartile 25% (IQ1) | 5.5% | 7.7% |
| Interquartile 75% (IQ3) | 11.2% | 19.4% |
| Interquartile Range (IQR) | 5.7% | 11.8% |
| Standard Deviation (Sample) | 4.5% | 7.7% |
| Standard Deviation (Population) | 4.4% | 7.6% |
Similar Demographics by Master's Degree
Demographics Similar to Guatemalans by Master's Degree
In terms of master's degree, the demographic groups most similar to Guatemalans are Immigrants from Honduras (11.8%, a difference of 0.080%), Ute (11.7%, a difference of 0.24%), Immigrants from Haiti (11.8%, a difference of 0.25%), Aleut (11.8%, a difference of 0.44%), and Immigrants from Nicaragua (11.8%, a difference of 0.80%).
| Demographics | Rating | Rank | Master's Degree |
| Immigrants | El Salvador | 0.2 /100 | #282 | Tragic 12.0% |
| Hondurans | 0.2 /100 | #283 | Tragic 11.9% |
| Ottawa | 0.2 /100 | #284 | Tragic 11.9% |
| Immigrants | Nicaragua | 0.2 /100 | #285 | Tragic 11.8% |
| Aleuts | 0.1 /100 | #286 | Tragic 11.8% |
| Immigrants | Haiti | 0.1 /100 | #287 | Tragic 11.8% |
| Immigrants | Honduras | 0.1 /100 | #288 | Tragic 11.8% |
| Guatemalans | 0.1 /100 | #289 | Tragic 11.7% |
| Ute | 0.1 /100 | #290 | Tragic 11.7% |
| Colville | 0.1 /100 | #291 | Tragic 11.6% |
| Immigrants | Guatemala | 0.1 /100 | #292 | Tragic 11.6% |
| Alaska Natives | 0.1 /100 | #293 | Tragic 11.6% |
| Hawaiians | 0.1 /100 | #294 | Tragic 11.6% |
| Marshallese | 0.1 /100 | #295 | Tragic 11.6% |
| Alaskan Athabascans | 0.1 /100 | #296 | Tragic 11.6% |
Demographics Similar to Ugandans by Master's Degree
In terms of master's degree, the demographic groups most similar to Ugandans are Immigrants from Italy (17.2%, a difference of 0.13%), Immigrants from North America (17.2%, a difference of 0.19%), Romanian (17.2%, a difference of 0.24%), Immigrants from Egypt (17.2%, a difference of 0.31%), and Immigrants from Morocco (17.1%, a difference of 0.32%).
| Demographics | Rating | Rank | Master's Degree |
| Maltese | 99.3 /100 | #87 | Exceptional 17.3% |
| Immigrants | Canada | 99.2 /100 | #88 | Exceptional 17.2% |
| Bhutanese | 99.1 /100 | #89 | Exceptional 17.2% |
| Immigrants | Egypt | 99.1 /100 | #90 | Exceptional 17.2% |
| Romanians | 99.1 /100 | #91 | Exceptional 17.2% |
| Immigrants | North America | 99.1 /100 | #92 | Exceptional 17.2% |
| Immigrants | Italy | 99.1 /100 | #93 | Exceptional 17.2% |
| Ugandans | 99.0 /100 | #94 | Exceptional 17.1% |
| Immigrants | Morocco | 98.9 /100 | #95 | Exceptional 17.1% |
| Immigrants | Northern Africa | 98.9 /100 | #96 | Exceptional 17.1% |
| Immigrants | England | 98.8 /100 | #97 | Exceptional 17.0% |
| Immigrants | Ukraine | 98.8 /100 | #98 | Exceptional 17.0% |
| Laotians | 98.8 /100 | #99 | Exceptional 17.0% |
| Albanians | 98.7 /100 | #100 | Exceptional 17.0% |
| Immigrants | Nepal | 98.6 /100 | #101 | Exceptional 17.0% |