Guamanian/Chamorro vs White/Caucasian Unemployment Among Women with Children Under 18 years
COMPARE
Guamanian/Chamorro
White/Caucasian
Unemployment Among Women with Children Under 18 years
Unemployment Among Women with Children Under 18 years Comparison
Guamanians/Chamorros
Whites/Caucasians
5.8%
UNEMPLOYMENT AMONG WOMEN WITH CHILDREN UNDER 18 YEARS
2.9/ 100
METRIC RATING
234th/ 347
METRIC RANK
5.3%
UNEMPLOYMENT AMONG WOMEN WITH CHILDREN UNDER 18 YEARS
82.9/ 100
METRIC RATING
127th/ 347
METRIC RANK
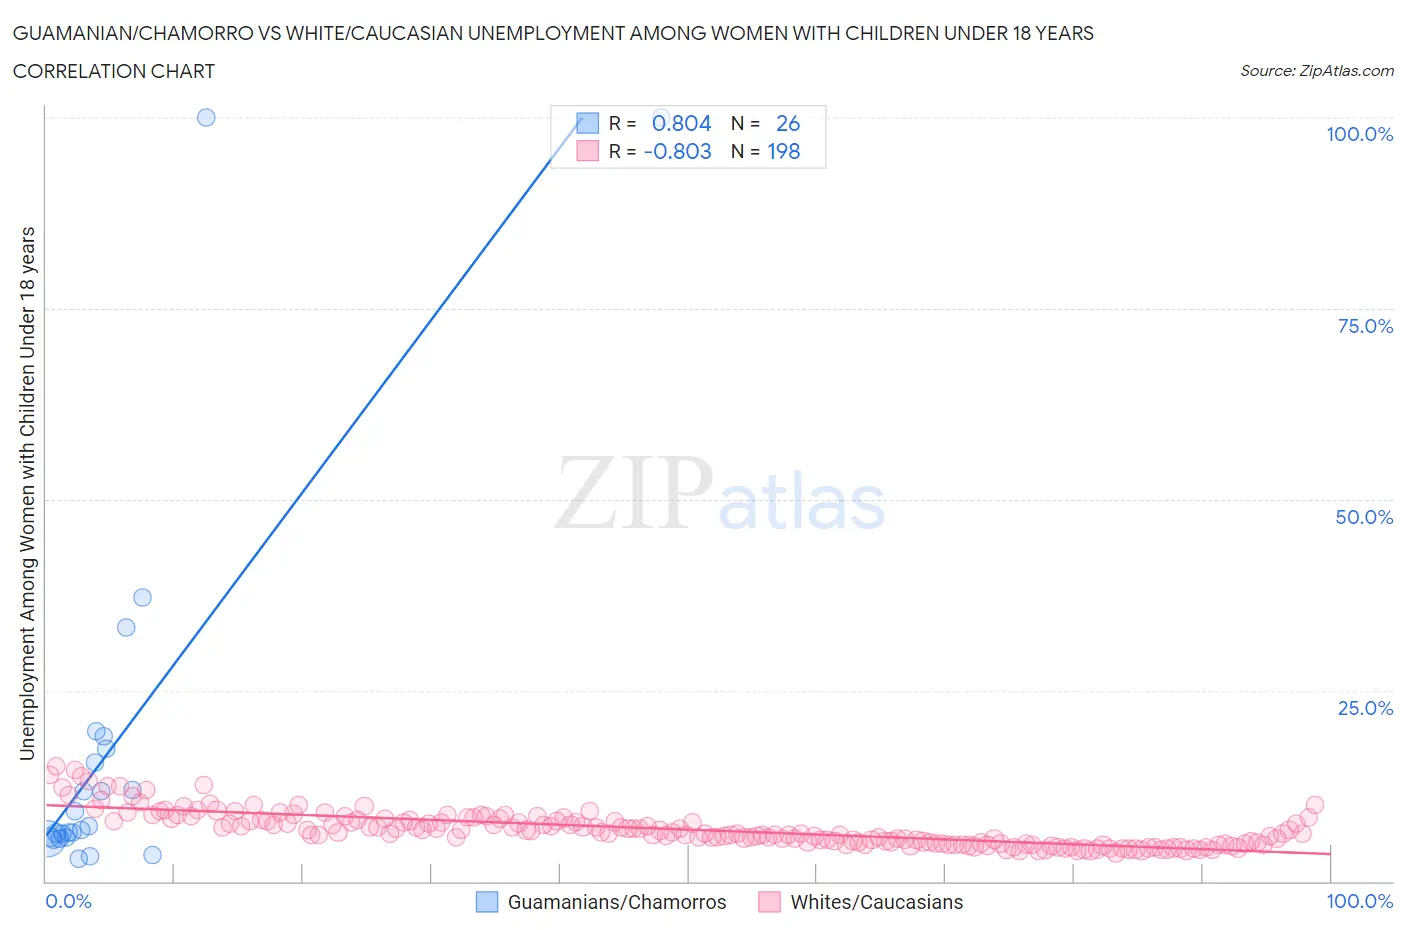
Guamanian/Chamorro vs White/Caucasian Unemployment Among Women with Children Under 18 years Correlation Chart
The statistical analysis conducted on geographies consisting of 217,637,806 people shows a very strong positive correlation between the proportion of Guamanians/Chamorros and unemployment rate among women with children under the age of 18 in the United States with a correlation coefficient (R) of 0.804 and weighted average of 5.8%. Similarly, the statistical analysis conducted on geographies consisting of 523,047,491 people shows a very strong negative correlation between the proportion of Whites/Caucasians and unemployment rate among women with children under the age of 18 in the United States with a correlation coefficient (R) of -0.803 and weighted average of 5.3%, a difference of 9.3%.
Unemployment Among Women with Children Under 18 years Correlation Summary
| Measurement | Guamanian/Chamorro | White/Caucasian |
| Minimum | 3.0% | 3.7% |
| Maximum | 100.0% | 15.1% |
| Range | 97.0% | 11.4% |
| Mean | 17.8% | 6.8% |
| Median | 6.9% | 6.2% |
| Interquartile 25% (IQ1) | 5.8% | 4.9% |
| Interquartile 75% (IQ3) | 17.3% | 8.0% |
| Interquartile Range (IQR) | 11.5% | 3.0% |
| Standard Deviation (Sample) | 25.7% | 2.3% |
| Standard Deviation (Population) | 25.2% | 2.3% |
Similar Demographics by Unemployment Among Women with Children Under 18 years
Demographics Similar to Guamanians/Chamorros by Unemployment Among Women with Children Under 18 years
In terms of unemployment among women with children under 18 years, the demographic groups most similar to Guamanians/Chamorros are Immigrants from Middle Africa (5.8%, a difference of 0.040%), Spanish American (5.8%, a difference of 0.11%), Creek (5.8%, a difference of 0.13%), Immigrants from Africa (5.8%, a difference of 0.15%), and Immigrants from South America (5.8%, a difference of 0.21%).
| Demographics | Rating | Rank | Unemployment Among Women with Children Under 18 years |
| Sierra Leoneans | 3.8 /100 | #227 | Tragic 5.8% |
| Somalis | 3.5 /100 | #228 | Tragic 5.8% |
| Immigrants | Panama | 3.4 /100 | #229 | Tragic 5.8% |
| Immigrants | South America | 3.2 /100 | #230 | Tragic 5.8% |
| Immigrants | Africa | 3.1 /100 | #231 | Tragic 5.8% |
| Creek | 3.1 /100 | #232 | Tragic 5.8% |
| Spanish Americans | 3.1 /100 | #233 | Tragic 5.8% |
| Guamanians/Chamorros | 2.9 /100 | #234 | Tragic 5.8% |
| Immigrants | Middle Africa | 2.8 /100 | #235 | Tragic 5.8% |
| Alsatians | 2.5 /100 | #236 | Tragic 5.8% |
| Immigrants | Lebanon | 2.4 /100 | #237 | Tragic 5.8% |
| Immigrants | Somalia | 2.2 /100 | #238 | Tragic 5.8% |
| Immigrants | Sierra Leone | 2.0 /100 | #239 | Tragic 5.8% |
| Immigrants | Immigrants | 2.0 /100 | #240 | Tragic 5.8% |
| Brazilians | 1.6 /100 | #241 | Tragic 5.8% |
Demographics Similar to Whites/Caucasians by Unemployment Among Women with Children Under 18 years
In terms of unemployment among women with children under 18 years, the demographic groups most similar to Whites/Caucasians are Immigrants from South Africa (5.3%, a difference of 0.010%), Immigrants from Oceania (5.3%, a difference of 0.030%), Immigrants from North Macedonia (5.3%, a difference of 0.040%), Immigrants from Italy (5.3%, a difference of 0.070%), and Immigrants from Austria (5.3%, a difference of 0.10%).
| Demographics | Rating | Rank | Unemployment Among Women with Children Under 18 years |
| Egyptians | 86.4 /100 | #120 | Excellent 5.3% |
| Immigrants | Romania | 85.8 /100 | #121 | Excellent 5.3% |
| Scotch-Irish | 85.7 /100 | #122 | Excellent 5.3% |
| Sudanese | 84.3 /100 | #123 | Excellent 5.3% |
| Native Hawaiians | 84.0 /100 | #124 | Excellent 5.3% |
| Immigrants | North Macedonia | 83.2 /100 | #125 | Excellent 5.3% |
| Immigrants | Oceania | 83.1 /100 | #126 | Excellent 5.3% |
| Whites/Caucasians | 82.9 /100 | #127 | Excellent 5.3% |
| Immigrants | South Africa | 82.8 /100 | #128 | Excellent 5.3% |
| Immigrants | Italy | 82.3 /100 | #129 | Excellent 5.3% |
| Immigrants | Austria | 82.1 /100 | #130 | Excellent 5.3% |
| Immigrants | Israel | 81.9 /100 | #131 | Excellent 5.3% |
| Immigrants | Ethiopia | 81.4 /100 | #132 | Excellent 5.3% |
| Ethiopians | 80.7 /100 | #133 | Excellent 5.3% |
| Slovaks | 80.5 /100 | #134 | Excellent 5.3% |