Guamanian/Chamorro vs Turkish Child Poverty Among Boys Under 16
COMPARE
Guamanian/Chamorro
Turkish
Child Poverty Among Boys Under 16
Child Poverty Among Boys Under 16 Comparison
Guamanians/Chamorros
Turks
16.1%
CHILD POVERTY AMONG BOYS UNDER 16
69.6/ 100
METRIC RATING
162nd/ 347
METRIC RANK
13.6%
CHILD POVERTY AMONG BOYS UNDER 16
99.8/ 100
METRIC RATING
31st/ 347
METRIC RANK
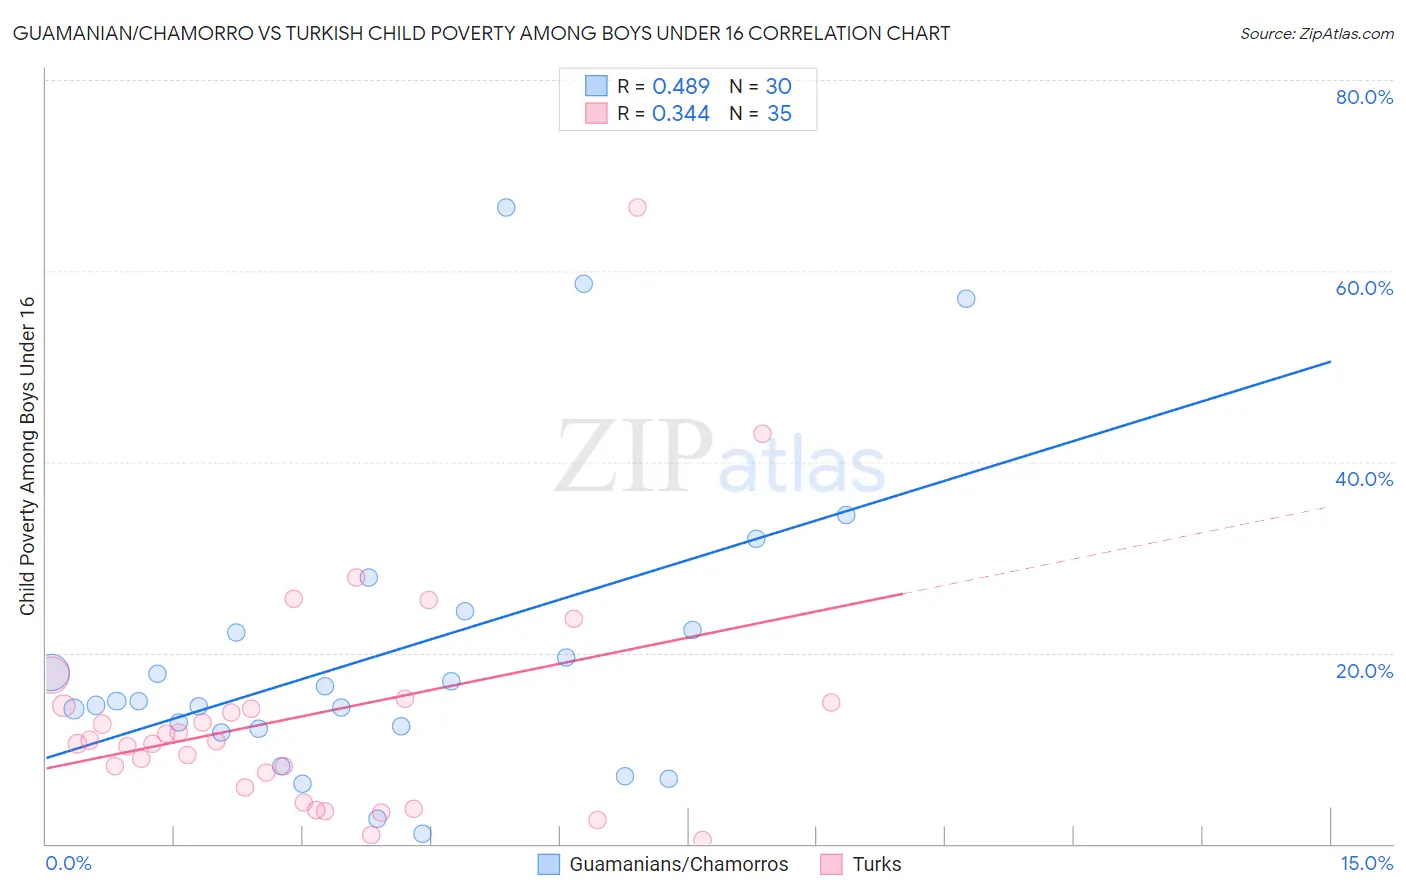
Guamanian/Chamorro vs Turkish Child Poverty Among Boys Under 16 Correlation Chart
The statistical analysis conducted on geographies consisting of 220,488,068 people shows a moderate positive correlation between the proportion of Guamanians/Chamorros and poverty level among boys under the age of 16 in the United States with a correlation coefficient (R) of 0.489 and weighted average of 16.1%. Similarly, the statistical analysis conducted on geographies consisting of 268,078,703 people shows a mild positive correlation between the proportion of Turks and poverty level among boys under the age of 16 in the United States with a correlation coefficient (R) of 0.344 and weighted average of 13.6%, a difference of 18.2%.
Child Poverty Among Boys Under 16 Correlation Summary
| Measurement | Guamanian/Chamorro | Turkish |
| Minimum | 1.0% | 0.40% |
| Maximum | 66.7% | 66.7% |
| Range | 65.6% | 66.3% |
| Mean | 20.1% | 13.5% |
| Median | 14.9% | 10.7% |
| Interquartile 25% (IQ1) | 12.0% | 5.9% |
| Interquartile 75% (IQ3) | 22.4% | 14.8% |
| Interquartile Range (IQR) | 10.3% | 8.9% |
| Standard Deviation (Sample) | 15.8% | 12.7% |
| Standard Deviation (Population) | 15.6% | 12.5% |
Similar Demographics by Child Poverty Among Boys Under 16
Demographics Similar to Guamanians/Chamorros by Child Poverty Among Boys Under 16
In terms of child poverty among boys under 16, the demographic groups most similar to Guamanians/Chamorros are Costa Rican (16.1%, a difference of 0.20%), Immigrants from Albania (16.1%, a difference of 0.22%), Immigrants from Oceania (16.0%, a difference of 0.23%), Immigrants from Northern Africa (16.0%, a difference of 0.24%), and Colombian (16.1%, a difference of 0.58%).
| Demographics | Rating | Rank | Child Poverty Among Boys Under 16 |
| French Canadians | 76.6 /100 | #155 | Good 15.9% |
| Israelis | 76.5 /100 | #156 | Good 15.9% |
| Immigrants | Nepal | 76.0 /100 | #157 | Good 15.9% |
| Yugoslavians | 75.9 /100 | #158 | Good 15.9% |
| Immigrants | Chile | 74.8 /100 | #159 | Good 15.9% |
| Immigrants | Northern Africa | 71.3 /100 | #160 | Good 16.0% |
| Immigrants | Oceania | 71.3 /100 | #161 | Good 16.0% |
| Guamanians/Chamorros | 69.6 /100 | #162 | Good 16.1% |
| Costa Ricans | 68.1 /100 | #163 | Good 16.1% |
| Immigrants | Albania | 67.9 /100 | #164 | Good 16.1% |
| Colombians | 65.2 /100 | #165 | Good 16.1% |
| Immigrants | Germany | 63.6 /100 | #166 | Good 16.2% |
| Afghans | 55.4 /100 | #167 | Average 16.3% |
| South Americans | 55.3 /100 | #168 | Average 16.3% |
| Immigrants | Saudi Arabia | 53.6 /100 | #169 | Average 16.4% |
Demographics Similar to Turks by Child Poverty Among Boys Under 16
In terms of child poverty among boys under 16, the demographic groups most similar to Turks are Swedish (13.6%, a difference of 0.080%), Immigrants from China (13.6%, a difference of 0.090%), Cypriot (13.6%, a difference of 0.18%), Danish (13.6%, a difference of 0.27%), and Eastern European (13.5%, a difference of 0.37%).
| Demographics | Rating | Rank | Child Poverty Among Boys Under 16 |
| Immigrants | Lithuania | 99.8 /100 | #24 | Exceptional 13.5% |
| Okinawans | 99.8 /100 | #25 | Exceptional 13.5% |
| Immigrants | Bolivia | 99.8 /100 | #26 | Exceptional 13.5% |
| Asians | 99.8 /100 | #27 | Exceptional 13.5% |
| Eastern Europeans | 99.8 /100 | #28 | Exceptional 13.5% |
| Cypriots | 99.8 /100 | #29 | Exceptional 13.6% |
| Swedes | 99.8 /100 | #30 | Exceptional 13.6% |
| Turks | 99.8 /100 | #31 | Exceptional 13.6% |
| Immigrants | China | 99.8 /100 | #32 | Exceptional 13.6% |
| Danes | 99.8 /100 | #33 | Exceptional 13.6% |
| Assyrians/Chaldeans/Syriacs | 99.8 /100 | #34 | Exceptional 13.6% |
| Russians | 99.7 /100 | #35 | Exceptional 13.8% |
| Luxembourgers | 99.7 /100 | #36 | Exceptional 13.8% |
| Immigrants | Sri Lanka | 99.6 /100 | #37 | Exceptional 13.9% |
| Immigrants | Northern Europe | 99.6 /100 | #38 | Exceptional 13.9% |