Estonian vs Turkish Child Poverty Among Boys Under 16
COMPARE
Estonian
Turkish
Child Poverty Among Boys Under 16
Child Poverty Among Boys Under 16 Comparison
Estonians
Turks
14.1%
CHILD POVERTY AMONG BOYS UNDER 16
99.4/ 100
METRIC RATING
44th/ 347
METRIC RANK
13.6%
CHILD POVERTY AMONG BOYS UNDER 16
99.8/ 100
METRIC RATING
31st/ 347
METRIC RANK
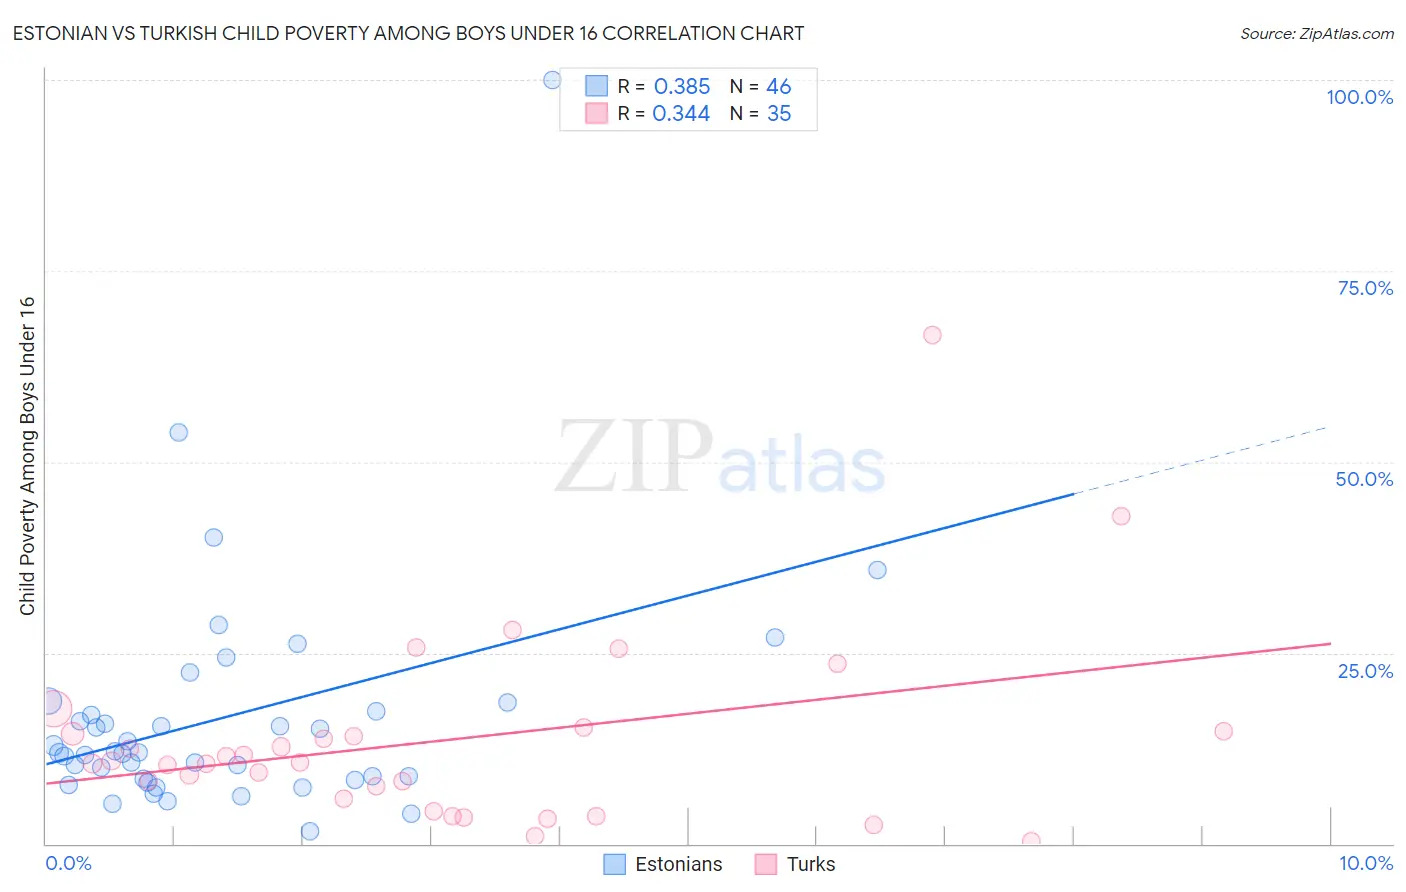
Estonian vs Turkish Child Poverty Among Boys Under 16 Correlation Chart
The statistical analysis conducted on geographies consisting of 122,063,894 people shows a mild positive correlation between the proportion of Estonians and poverty level among boys under the age of 16 in the United States with a correlation coefficient (R) of 0.385 and weighted average of 14.1%. Similarly, the statistical analysis conducted on geographies consisting of 268,078,703 people shows a mild positive correlation between the proportion of Turks and poverty level among boys under the age of 16 in the United States with a correlation coefficient (R) of 0.344 and weighted average of 13.6%, a difference of 3.5%.
Child Poverty Among Boys Under 16 Correlation Summary
| Measurement | Estonian | Turkish |
| Minimum | 1.7% | 0.40% |
| Maximum | 100.0% | 66.7% |
| Range | 98.3% | 66.3% |
| Mean | 16.6% | 13.5% |
| Median | 12.0% | 10.7% |
| Interquartile 25% (IQ1) | 8.4% | 5.9% |
| Interquartile 75% (IQ3) | 17.4% | 14.8% |
| Interquartile Range (IQR) | 9.0% | 8.9% |
| Standard Deviation (Sample) | 16.0% | 12.7% |
| Standard Deviation (Population) | 15.8% | 12.5% |
Demographics Similar to Estonians and Turks by Child Poverty Among Boys Under 16
In terms of child poverty among boys under 16, the demographic groups most similar to Estonians are Immigrants from Scotland (14.1%, a difference of 0.090%), Greek (14.1%, a difference of 0.20%), Croatian (14.0%, a difference of 0.21%), Immigrants from Moldova (14.1%, a difference of 0.47%), and Korean (14.0%, a difference of 0.71%). Similarly, the demographic groups most similar to Turks are Swedish (13.6%, a difference of 0.080%), Immigrants from China (13.6%, a difference of 0.090%), Cypriot (13.6%, a difference of 0.18%), Danish (13.6%, a difference of 0.27%), and Eastern European (13.5%, a difference of 0.37%).
| Demographics | Rating | Rank | Child Poverty Among Boys Under 16 |
| Asians | 99.8 /100 | #27 | Exceptional 13.5% |
| Eastern Europeans | 99.8 /100 | #28 | Exceptional 13.5% |
| Cypriots | 99.8 /100 | #29 | Exceptional 13.6% |
| Swedes | 99.8 /100 | #30 | Exceptional 13.6% |
| Turks | 99.8 /100 | #31 | Exceptional 13.6% |
| Immigrants | China | 99.8 /100 | #32 | Exceptional 13.6% |
| Danes | 99.8 /100 | #33 | Exceptional 13.6% |
| Assyrians/Chaldeans/Syriacs | 99.8 /100 | #34 | Exceptional 13.6% |
| Russians | 99.7 /100 | #35 | Exceptional 13.8% |
| Luxembourgers | 99.7 /100 | #36 | Exceptional 13.8% |
| Immigrants | Sri Lanka | 99.6 /100 | #37 | Exceptional 13.9% |
| Immigrants | Northern Europe | 99.6 /100 | #38 | Exceptional 13.9% |
| Immigrants | Australia | 99.6 /100 | #39 | Exceptional 13.9% |
| Immigrants | Asia | 99.6 /100 | #40 | Exceptional 13.9% |
| Lithuanians | 99.6 /100 | #41 | Exceptional 14.0% |
| Koreans | 99.6 /100 | #42 | Exceptional 14.0% |
| Croatians | 99.5 /100 | #43 | Exceptional 14.0% |
| Estonians | 99.4 /100 | #44 | Exceptional 14.1% |
| Immigrants | Scotland | 99.4 /100 | #45 | Exceptional 14.1% |
| Greeks | 99.4 /100 | #46 | Exceptional 14.1% |
| Immigrants | Moldova | 99.4 /100 | #47 | Exceptional 14.1% |