Greek vs Immigrants from South Africa Family Poverty
COMPARE
Greek
Immigrants from South Africa
Family Poverty
Family Poverty Comparison
Greeks
Immigrants from South Africa
7.5%
FAMILY POVERTY
99.4/ 100
METRIC RATING
35th/ 347
METRIC RANK
8.1%
FAMILY POVERTY
95.9/ 100
METRIC RATING
98th/ 347
METRIC RANK
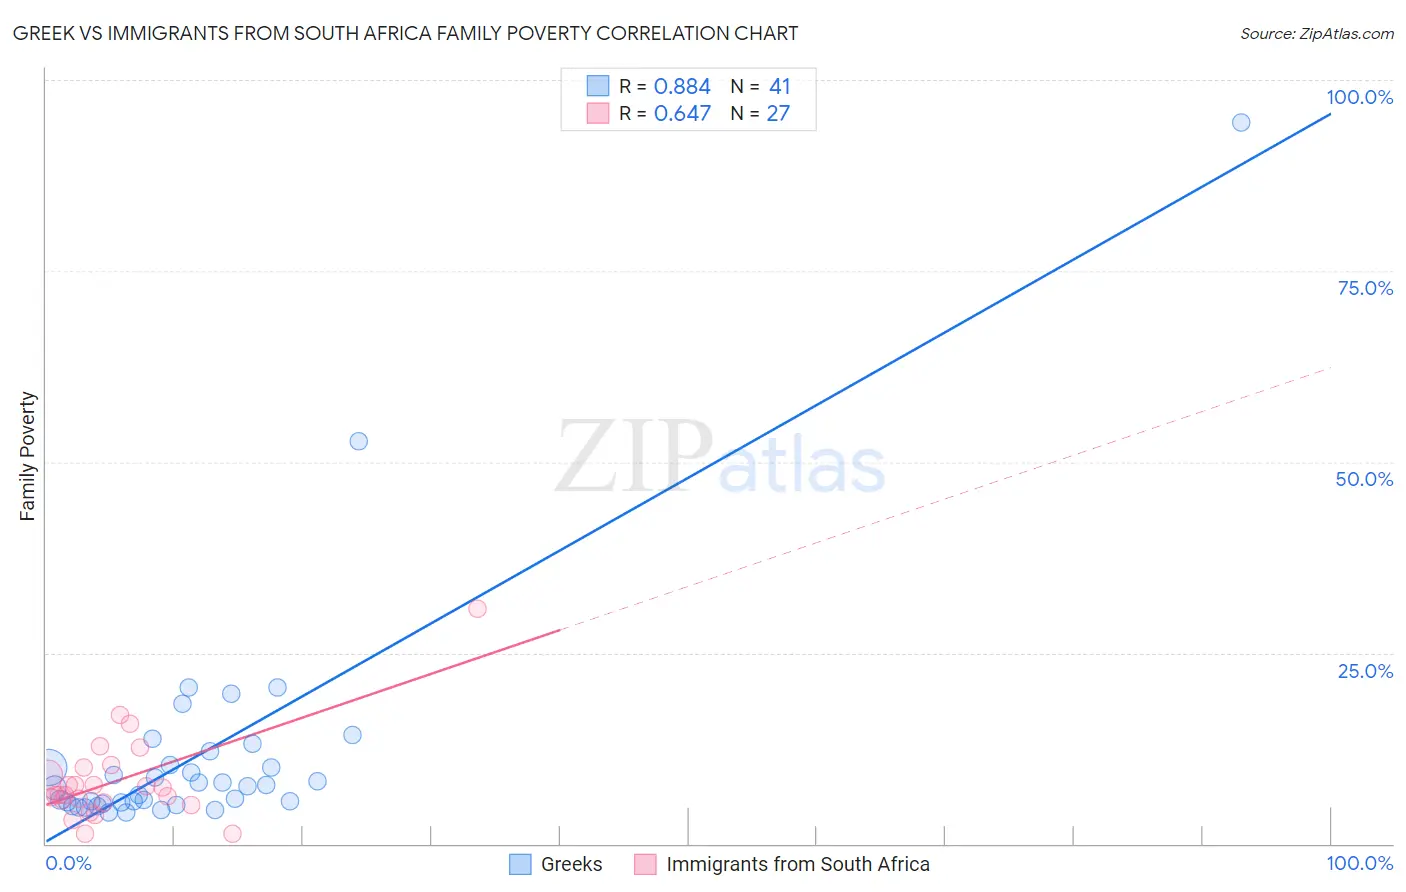
Greek vs Immigrants from South Africa Family Poverty Correlation Chart
The statistical analysis conducted on geographies consisting of 480,426,664 people shows a very strong positive correlation between the proportion of Greeks and poverty level among families in the United States with a correlation coefficient (R) of 0.884 and weighted average of 7.5%. Similarly, the statistical analysis conducted on geographies consisting of 232,909,353 people shows a significant positive correlation between the proportion of Immigrants from South Africa and poverty level among families in the United States with a correlation coefficient (R) of 0.647 and weighted average of 8.1%, a difference of 7.6%.
Family Poverty Correlation Summary
| Measurement | Greek | Immigrants from South Africa |
| Minimum | 4.1% | 1.3% |
| Maximum | 94.4% | 30.8% |
| Range | 90.3% | 29.4% |
| Mean | 11.7% | 8.3% |
| Median | 7.5% | 6.4% |
| Interquartile 25% (IQ1) | 5.3% | 5.4% |
| Interquartile 75% (IQ3) | 11.2% | 9.9% |
| Interquartile Range (IQR) | 5.9% | 4.5% |
| Standard Deviation (Sample) | 15.6% | 5.9% |
| Standard Deviation (Population) | 15.4% | 5.8% |
Similar Demographics by Family Poverty
Demographics Similar to Greeks by Family Poverty
In terms of family poverty, the demographic groups most similar to Greeks are Turkish (7.5%, a difference of 0.010%), Estonian (7.5%, a difference of 0.18%), Bolivian (7.5%, a difference of 0.43%), Carpatho Rusyn (7.5%, a difference of 0.49%), and Slovene (7.5%, a difference of 0.52%).
| Demographics | Rating | Rank | Family Poverty |
| Immigrants | Korea | 99.6 /100 | #28 | Exceptional 7.4% |
| Immigrants | Northern Europe | 99.6 /100 | #29 | Exceptional 7.4% |
| Italians | 99.6 /100 | #30 | Exceptional 7.4% |
| Czechs | 99.6 /100 | #31 | Exceptional 7.4% |
| Poles | 99.5 /100 | #32 | Exceptional 7.4% |
| Immigrants | Japan | 99.5 /100 | #33 | Exceptional 7.4% |
| Russians | 99.5 /100 | #34 | Exceptional 7.5% |
| Greeks | 99.4 /100 | #35 | Exceptional 7.5% |
| Turks | 99.4 /100 | #36 | Exceptional 7.5% |
| Estonians | 99.4 /100 | #37 | Exceptional 7.5% |
| Bolivians | 99.3 /100 | #38 | Exceptional 7.5% |
| Carpatho Rusyns | 99.3 /100 | #39 | Exceptional 7.5% |
| Slovenes | 99.3 /100 | #40 | Exceptional 7.5% |
| Immigrants | Australia | 99.2 /100 | #41 | Exceptional 7.6% |
| Scandinavians | 99.1 /100 | #42 | Exceptional 7.6% |
Demographics Similar to Immigrants from South Africa by Family Poverty
In terms of family poverty, the demographic groups most similar to Immigrants from South Africa are Welsh (8.1%, a difference of 0.070%), New Zealander (8.1%, a difference of 0.14%), Immigrants from Norway (8.1%, a difference of 0.17%), Immigrants from Indonesia (8.1%, a difference of 0.18%), and Immigrants from Switzerland (8.1%, a difference of 0.21%).
| Demographics | Rating | Rank | Family Poverty |
| Immigrants | Italy | 97.0 /100 | #91 | Exceptional 8.0% |
| Czechoslovakians | 96.8 /100 | #92 | Exceptional 8.0% |
| Tlingit-Haida | 96.7 /100 | #93 | Exceptional 8.0% |
| Immigrants | Pakistan | 96.6 /100 | #94 | Exceptional 8.0% |
| Immigrants | Philippines | 96.5 /100 | #95 | Exceptional 8.0% |
| Immigrants | Turkey | 96.5 /100 | #96 | Exceptional 8.0% |
| Immigrants | Switzerland | 96.1 /100 | #97 | Exceptional 8.1% |
| Immigrants | South Africa | 95.9 /100 | #98 | Exceptional 8.1% |
| Welsh | 95.8 /100 | #99 | Exceptional 8.1% |
| New Zealanders | 95.8 /100 | #100 | Exceptional 8.1% |
| Immigrants | Norway | 95.7 /100 | #101 | Exceptional 8.1% |
| Immigrants | Indonesia | 95.7 /100 | #102 | Exceptional 8.1% |
| Immigrants | Eastern Europe | 95.6 /100 | #103 | Exceptional 8.1% |
| Slavs | 95.6 /100 | #104 | Exceptional 8.1% |
| Laotians | 95.6 /100 | #105 | Exceptional 8.1% |